

4.1 Overview of Japan’s Healthcare Delivery System
International Comparison of Japan’s Healthcare Delivery System
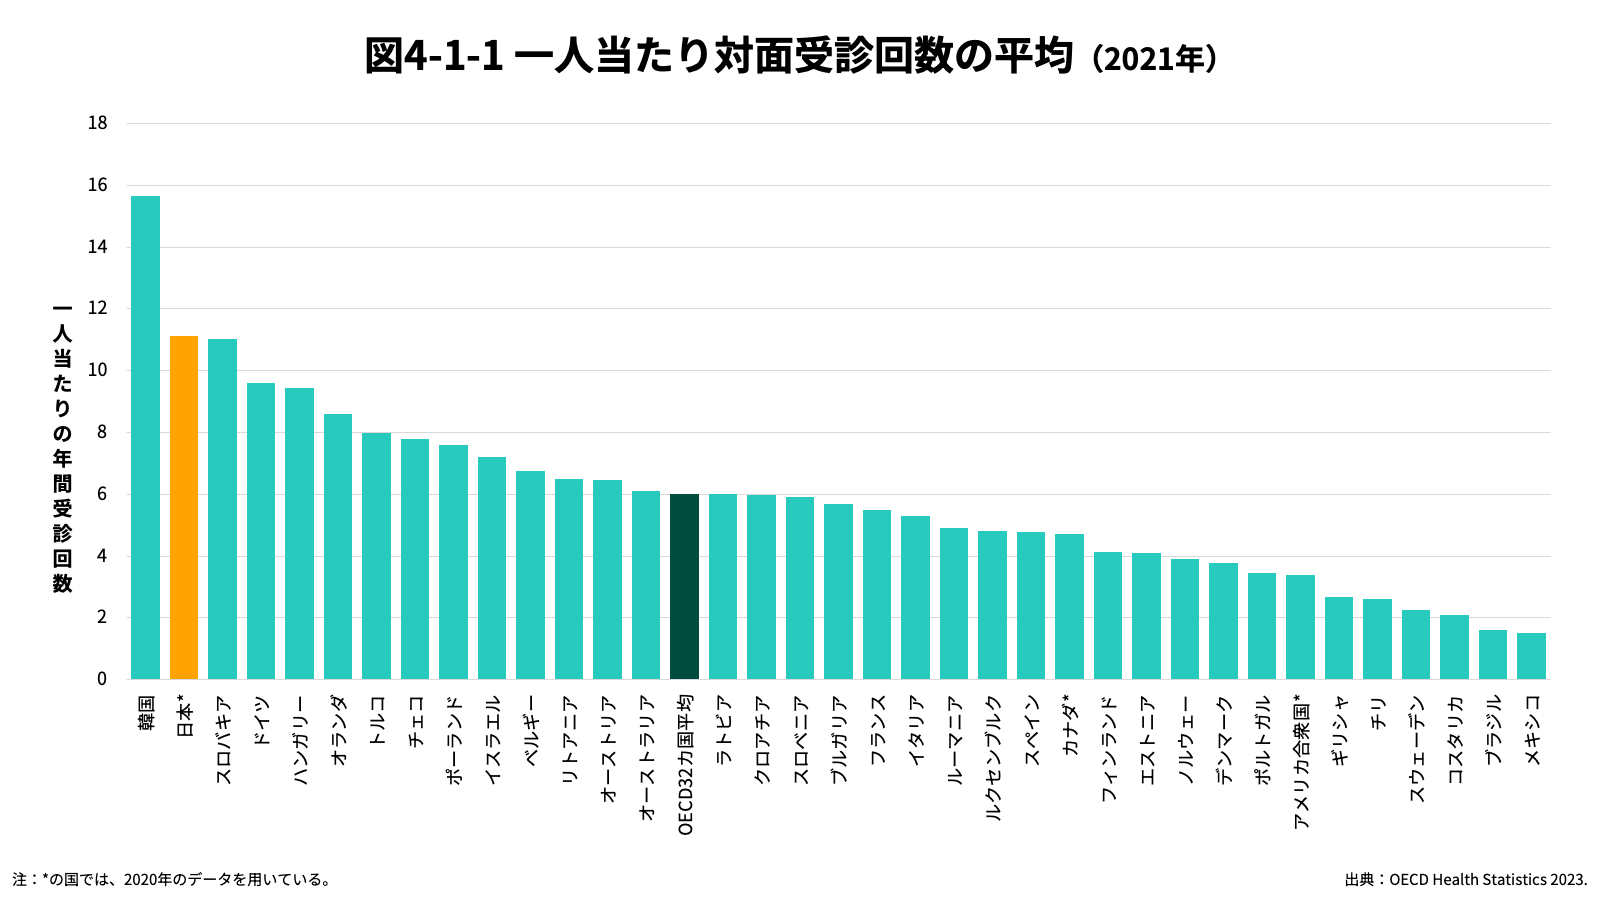
A defining characteristic of Japan’s healthcare delivery system is its large scale. Looking at consultation frequency as an indicator of the scale of outpatient care, as of 2021 the average number of visits per person was 11.1 per year, the second highest among OECD countries after South Korea.
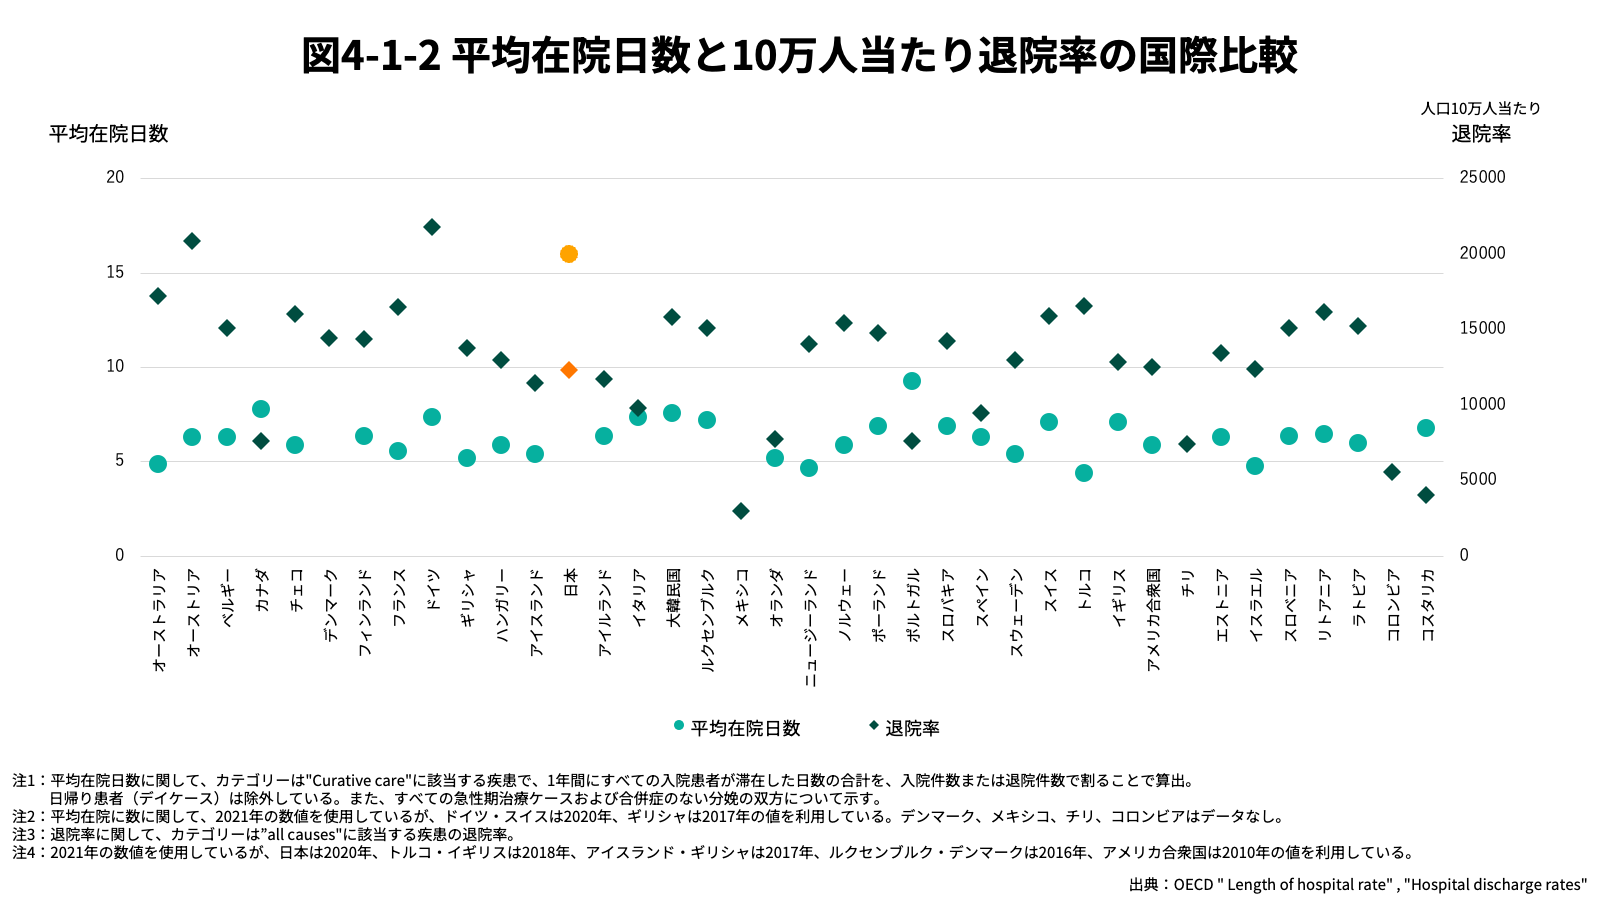
With regard to inpatient care, the discharge rate, which indicates the frequency of hospital admissions, places Japan around the middle among OECD countries and does not appear particularly high. However, the average length of hospital stay is exceptionally long, exceedingly more than twice that of South Korea, which ranks second. Consequently, the overall scale of inpatient care provided in Japan can also be considered very large.
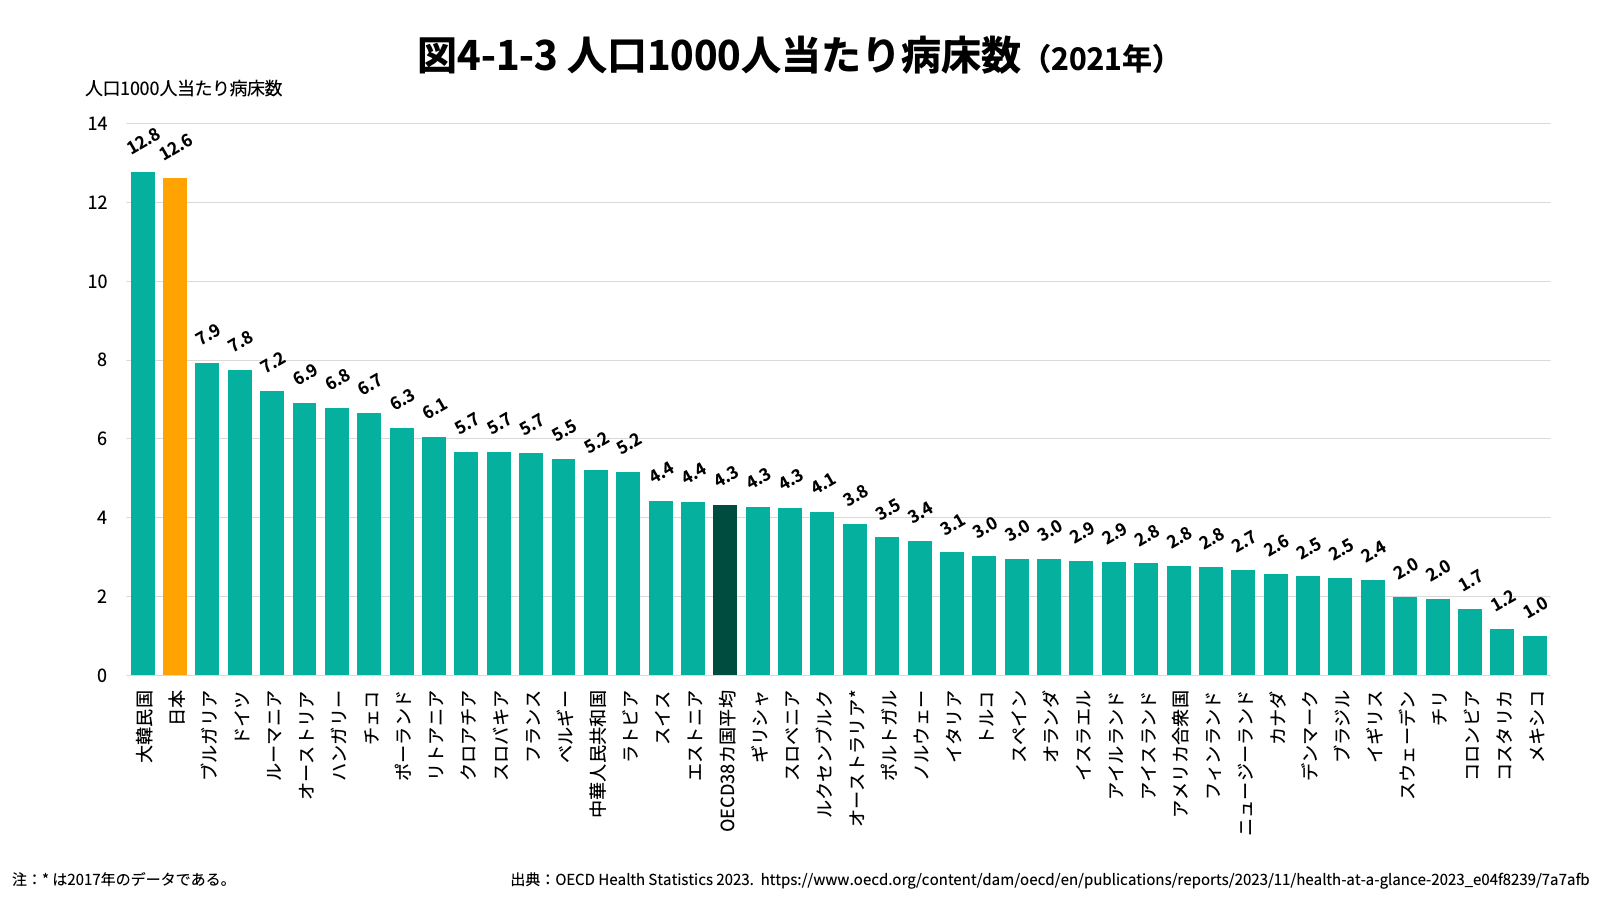
Reflecting the large scale of inpatient medical service provision, Japan has a high number of hospital beds per capita. As of 2021, there were 12.6 beds per 1,000 population, a level that stands out as exceptionally high alongside South Korea.
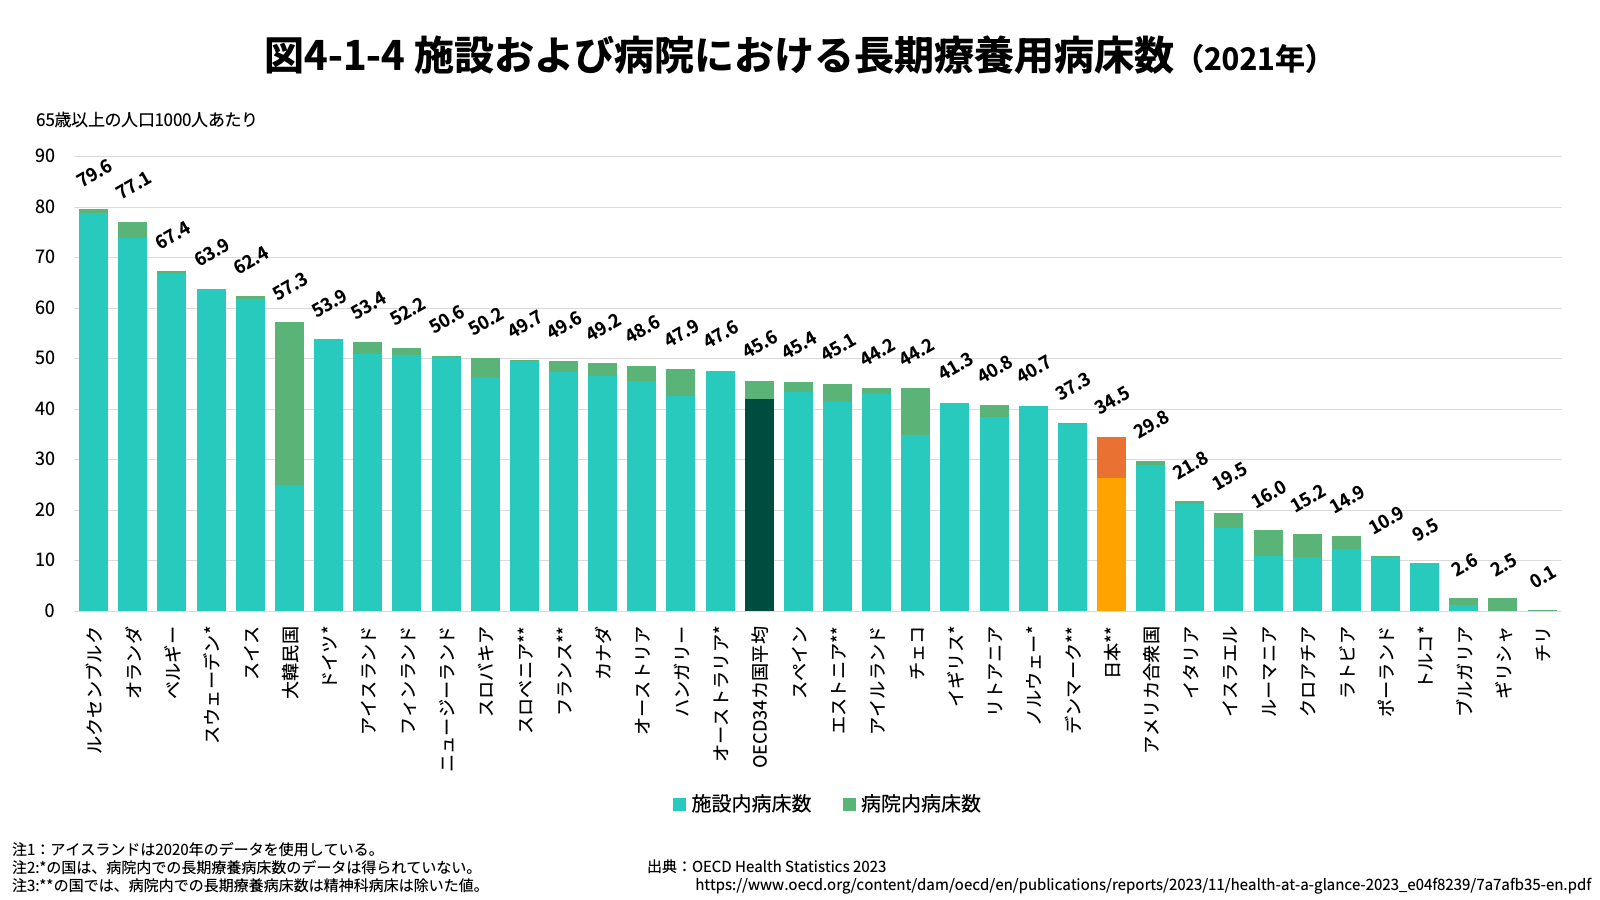
By contrast, the number of places in long-term care facilities relative to the elderly population is limited. In 2021, there were 34.5 beds per 1,000 people aged 65 and over, which can be considered slightly below the OECD average.
Despite the large scale of medical service provision, the number of physicians in Japan is relatively low. With 2.6 physicians per 1,000 population, Japan belongs to the lower group among OECD countries. However, in domestic policy debates, future population decline is expected to lead to an oversupply of physicians, and therefore a substantial increase in the number of doctors is not actively being considered. Instead, policy discussions focus on the efficient allocation of physicians at the micro level, particularly across regions and medical specialties.
By contrast, when compared with other OECD countries, Japan has relatively high numbers of pharmacists and nurses.
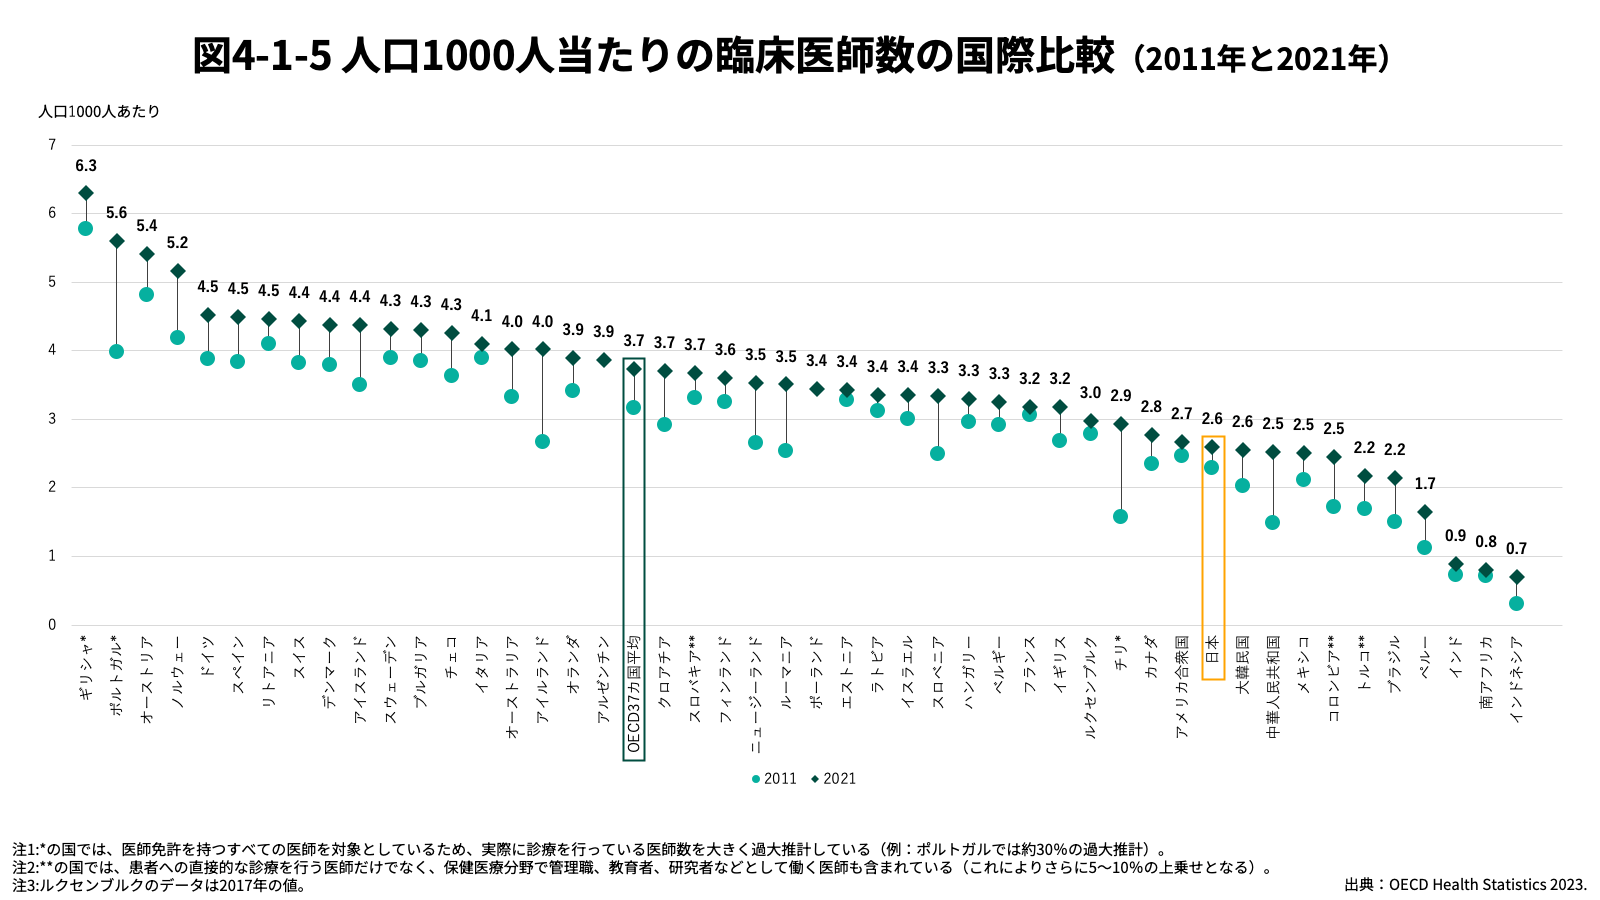
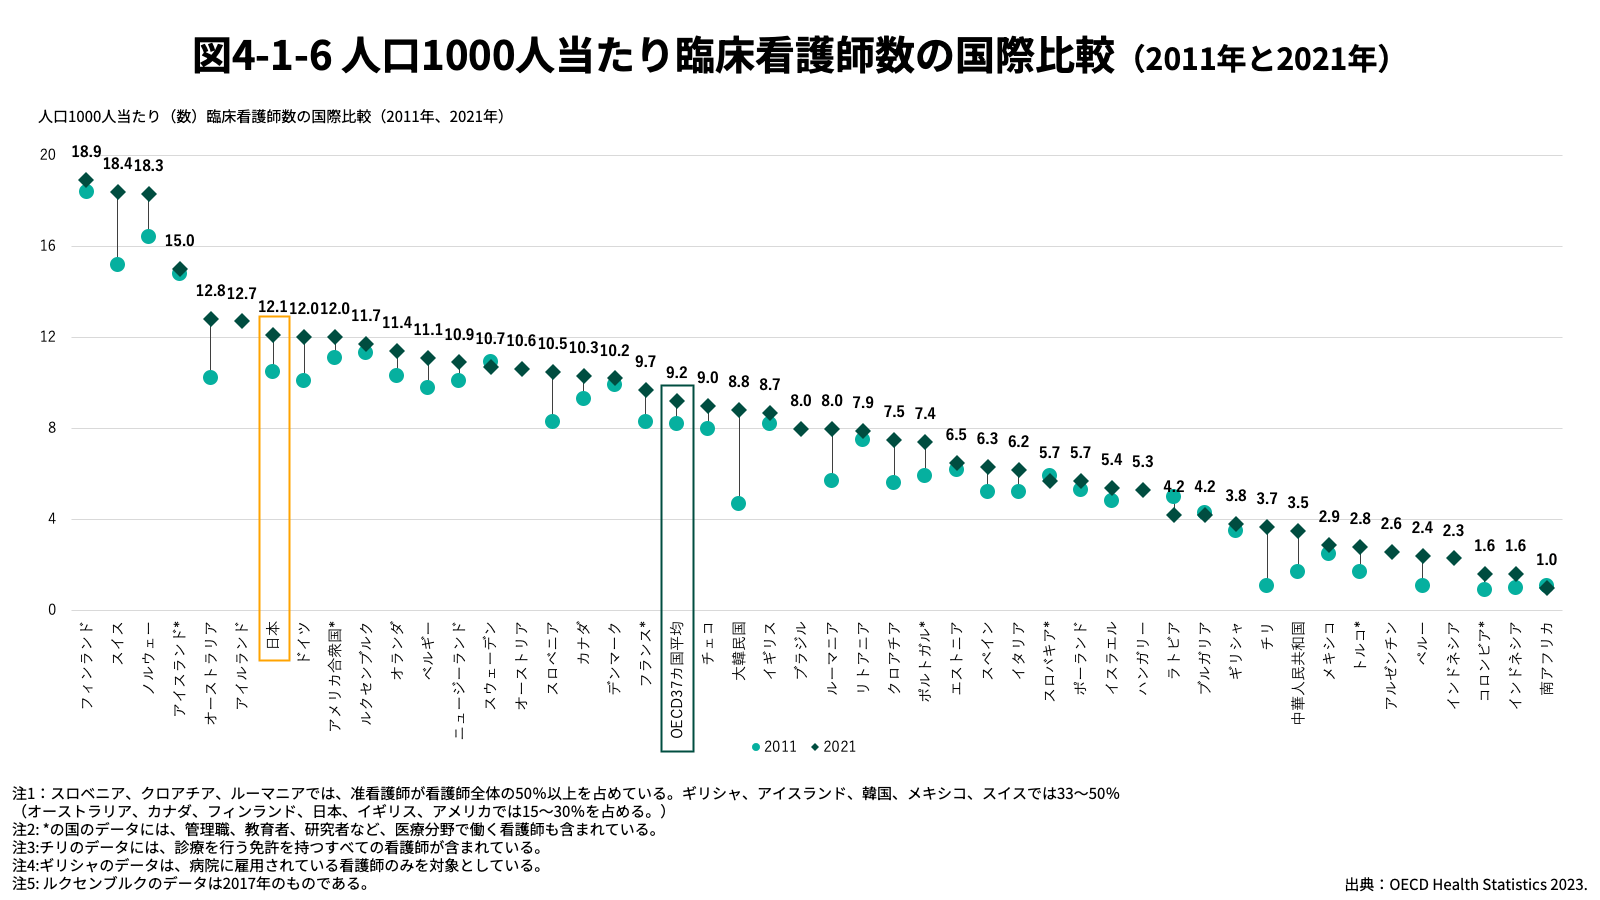
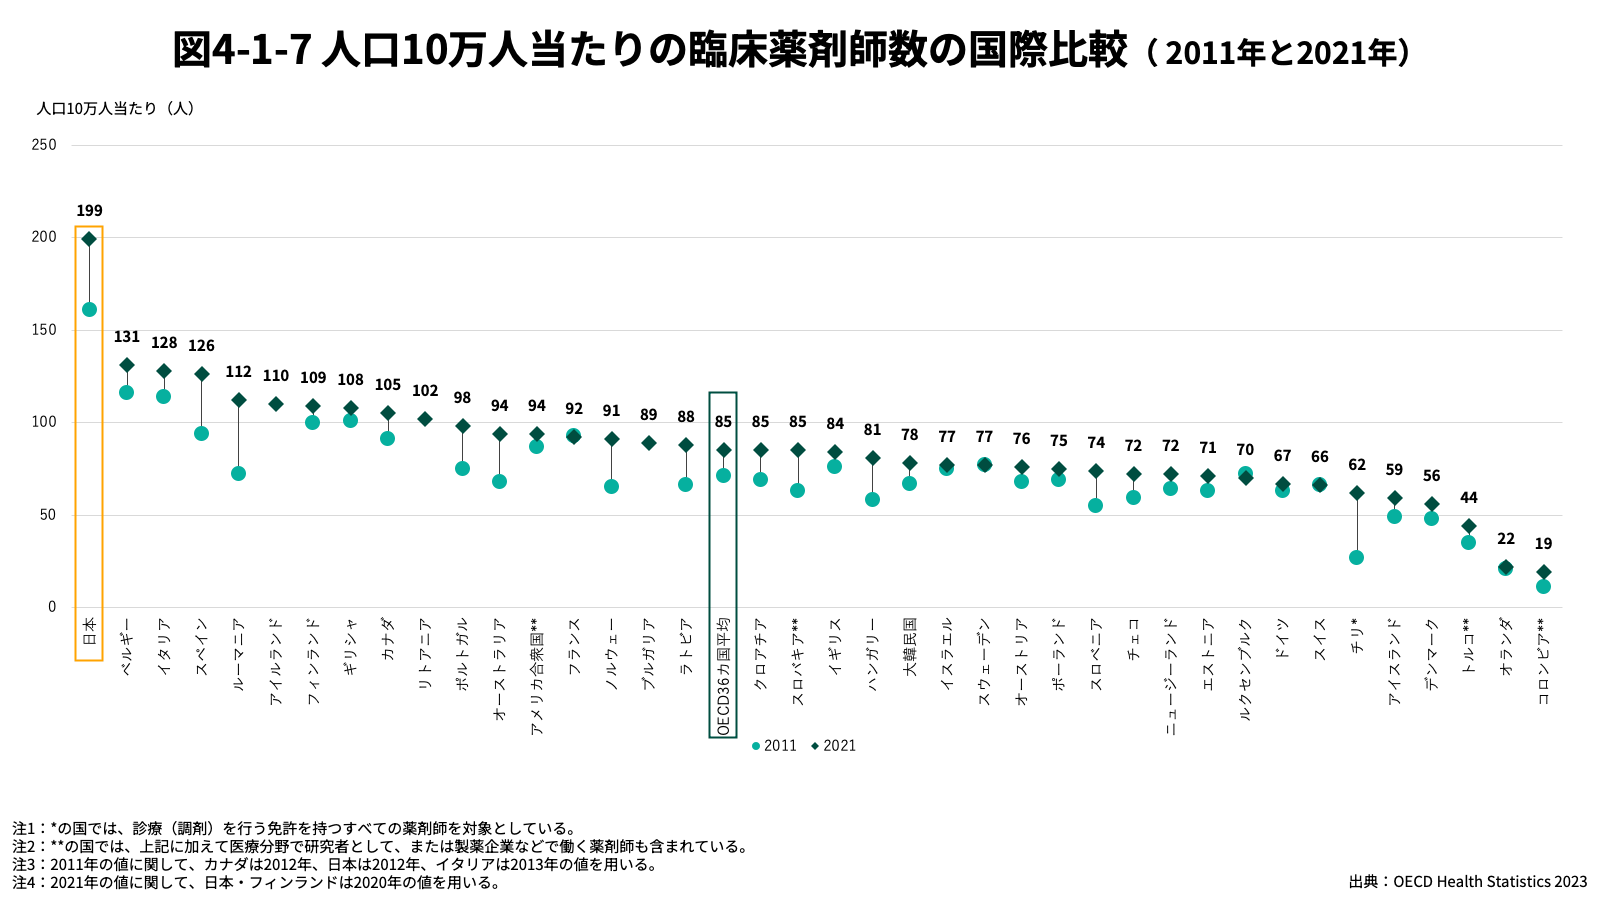
Healthcare Delivery System Oriented towards the Private Sector
The characteristics of Japan’s healthcare delivery system described above can largely be explained by the prominent role played by the private sector.[1] A substantial proportion of outpatient care is provided within the private sector, which also accounts for a large share of hospital beds, and is associated with a tendency towards longer average lengths of hospital stay. It should be noted that the term “private sector” as used here does not refer to for-profit enterprises, but rather to privately operated medical corporations that are not publicly owned.
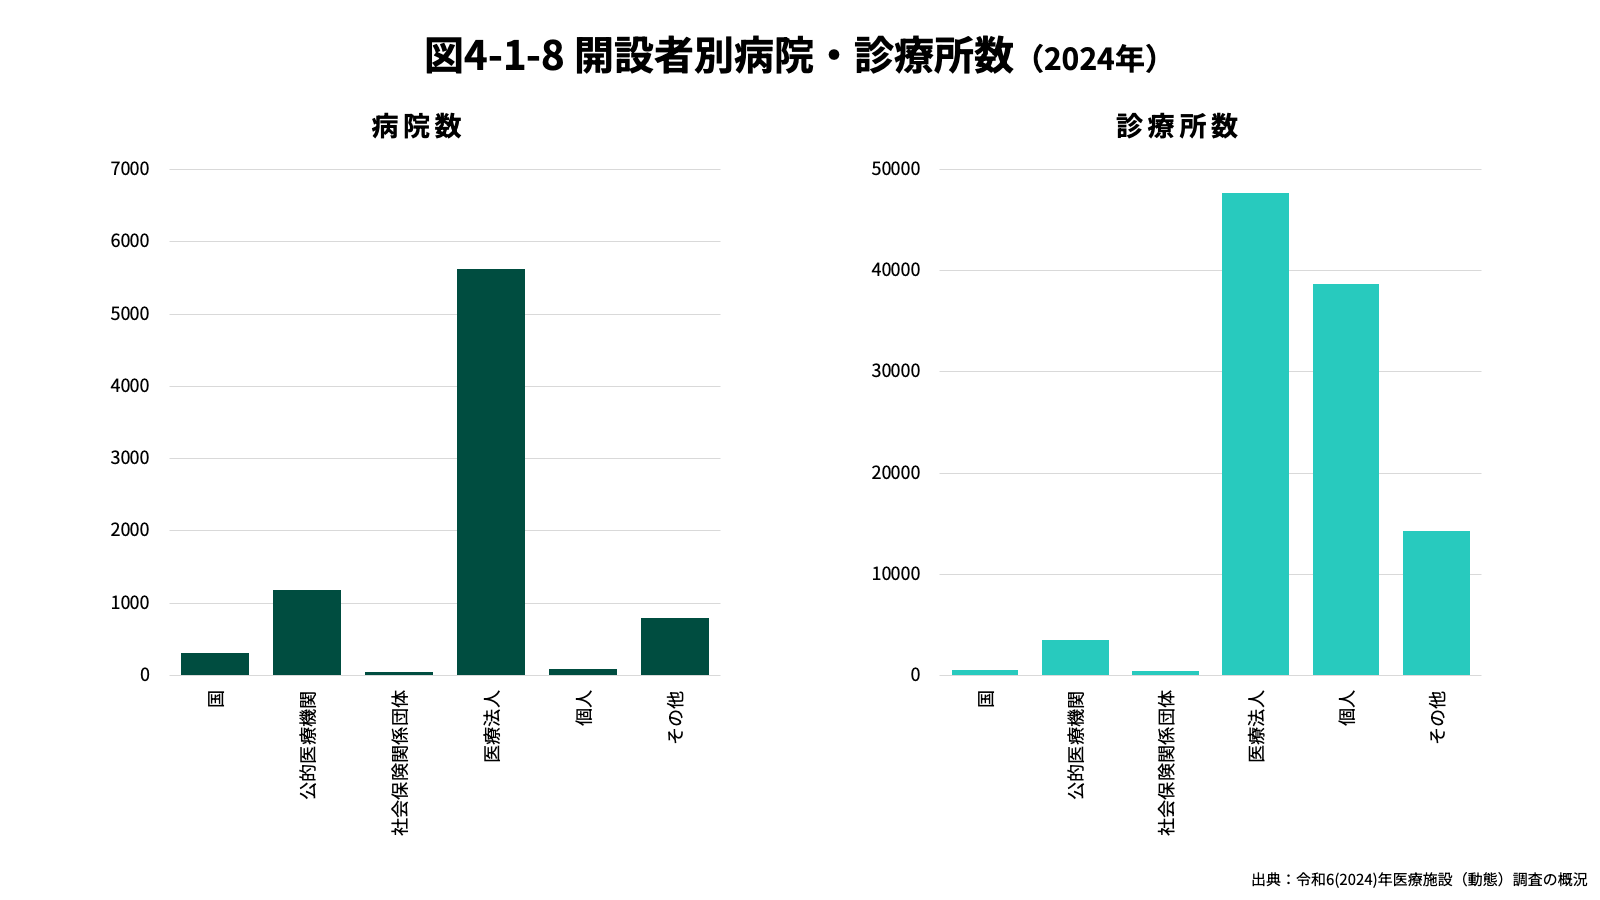
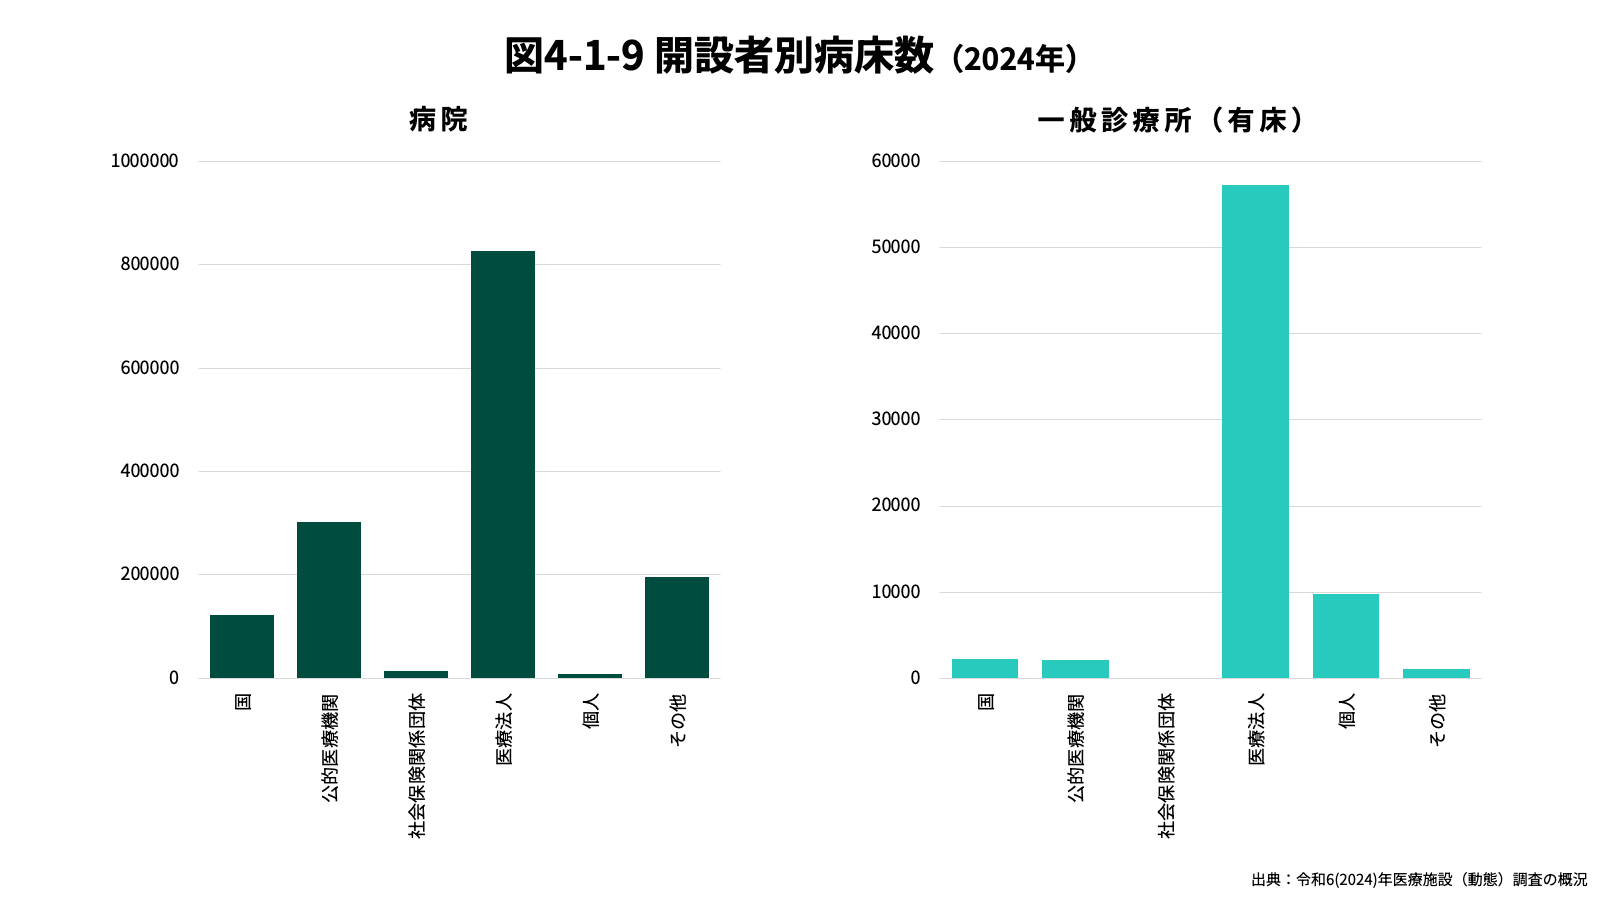
First, it is important to confirm that the private sector is larger in scale than the public sector.[2] In terms of the number of medical institutions, the private sector accounts for more than 70 per cent of hospitals and approximately 82 per cent of clinics (Figure 4-1-8). When measured by the number of beds, the private sector accounts for around 57 per cent of hospital beds and approximately 93 per cent of clinic beds (Figure 4-1-9). This structural configuration is widely regarded as one of the defining characteristics of Japan’s healthcare delivery system.[3]
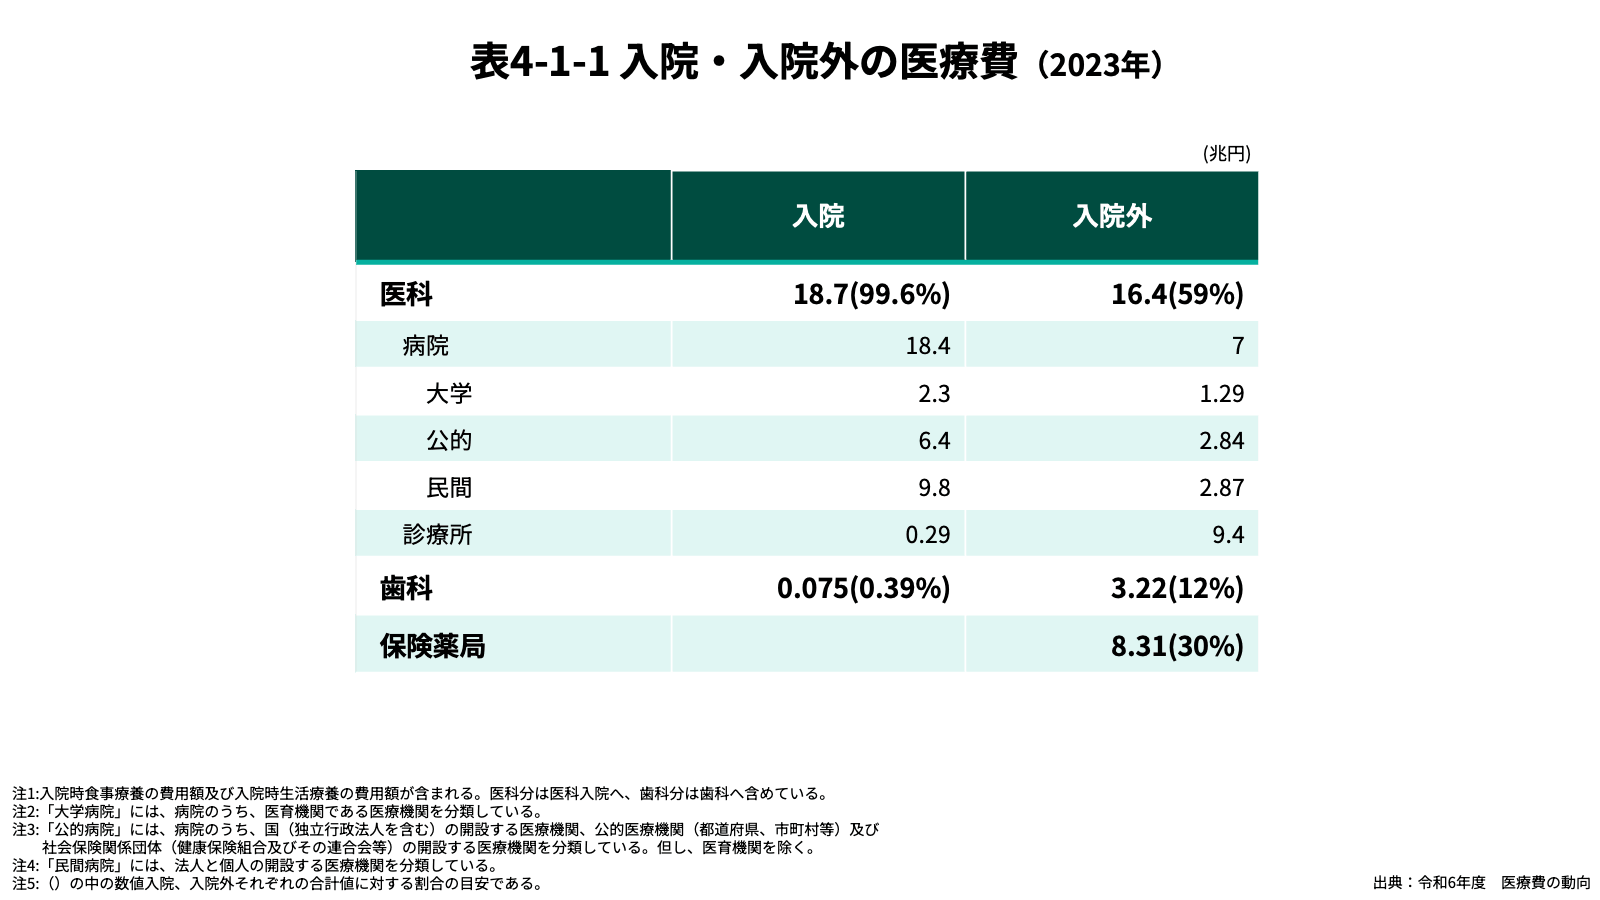
In the provision of outpatient care as well, the private sector accounts for a substantial share. Approximately 57.3 per cent of outpatient medical expenditure is attributable to clinics,[4] while of the remaining share provided by hospitals, around 41 per cent is accounted for by the private sector.
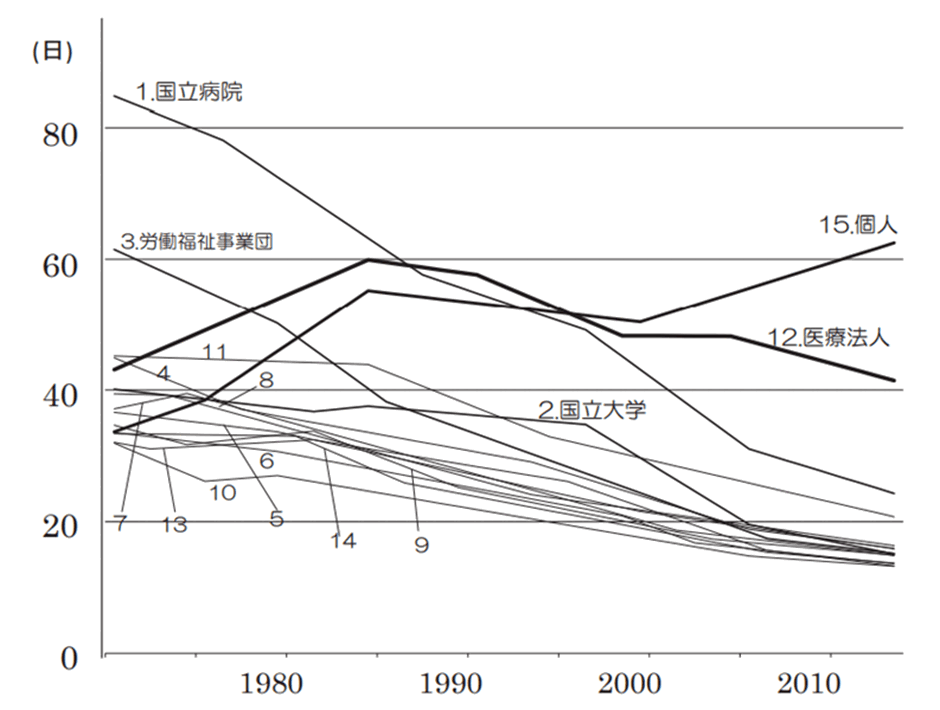
Despite an overall trend towards shorter average lengths of hospital stay, sectoral analysis reveals that this trend has been more modest within the private sector, and in some cases has even shifted towards longer stays.
Figure 14: Trends in Average Length of Hospital Stay by Ownership Type
Free Access
Japan’s system of healthcare access is generally regarded as being of a high standard. A key mechanism underpinning this accessibility is the principle of free access, which allows individuals to choose and consult medical institutions freely, based on their own judgement. The vast majority of healthcare providers in Japan are registered as service providers under the public health insurance system, and insured individuals are therefore able to receive necessary medical services with a fixed level of cost-sharing.[5]
As a result, waiting times for outpatient consultations are relatively short. The largest proportion of patients (27.9 per cent) report waiting less than 15 minutes, followed by those waiting between 15 and 30 minutes (24.9 per cent), and between 30 minutes and one hour (20.6 per cent). In total, approximately 70 per cent of patients are seen within one hour. Similarly, the interval between being diagnosed as requiring hospitalization and actual admission is short: 70.3 per cent of inpatients are admitted within one week, while a further 23.1 per cent are admitted within one week to one month, together accounting for over 80 per cent of cases.[6]
| Total | No beds available | Unable to secure reservations for surgery or examination | Personal or family circumstances | Financial reasons | Other | Do not know | Not specified | |
|---|---|---|---|---|---|---|---|---|
| Total | 100 | 15.1 | 20.6 | 21.7 | 1.2 | 21.5 | 10.8 | 9.1 |
| Less than one week※ | 70.3 | N.A. | N.A. | N.A. | N.A. | N.A. | N.A. | N.A. |
| One week to under a month | 23.1 | 4.11 | 3.93 | 4.76 | 0.30 | 4.85 | 2.86 | 2.31 |
| One month or more | 14.3 | 1.56 | 3.76 | 3.36 | 0.16 | 3.19 | 1.19 | 1.09 |
| Do not recall | 4.3 | N.A. | N.A. | N.A. | N.A. | N.A. | N.A. | N.A. |
| Not specified | 5.5 | N.A. | N.A. | N.A. | N.A. | N.A. | N.A. | N.A. |
※ Including emergency admissions or ambulance transport
In recent years, however, concerns have been raised regarding the unintended consequences of the free access system, particularly the tendency towards excessive or unnecessary healthcare utilization. It has been suggested that outpatient demand has become concentrated in certain hospitals, giving rise to challenges such as longer waiting times for patients and an increased outpatient workload for hospital-based physicians. One frequently cited example is the use of highly specialized medical institutions during night-time hours by patients with relatively minor conditions, despite such facilities being primarily intended for individuals requiring hospitalization or surgical intervention.
In response to these issues, policy measures have been introduced to guide patient healthcare-seeking behavior. In particular, systems have been implemented whereby patients who seek care at highly specialized medical institutions during night-time hours or without a referral incur additional out-of-pocket charges compared with standard visits. These measures aim to encourage more appropriate use of medical resources and to alleviate pressures on advanced care facilities.
- [1] In this report, medical institutions established and operated by medical corporations or individual practitioners are classified as belonging to the private sector. Although a limited number of medical institutions established by for-profit enterprises exist due to historical circumstances, the establishment of medical institutions for commercial purposes is currently highly restricted.
- [2] Ministry of Health, Labour and Welfare, The Current Status and Challenges of the Healthcare Delivery System. http://www.mhlw.go.jp/file/05-Shingikai-12601000-Seisakutoukatsukan-Sanjikanshitsu_Shakaihoshoutantou/0000184301.pdf
- [3] Ministry of Health, Labour and Welfare, Survey and Research Report on the Actual Conditions of Medical Corporations Overseas. http://www.mhlw.go.jp/file/06-Seisakujouhou-10800000-Iseikyoku/001_2.pdf
- [4] Strictly speaking, not all clinics are operated by private entities; however, it is generally considered that the majority are privately run.
- [5] Ministry of Health, Labour and Welfare, Japan’s Medical Insurance System. http://www.mhlw.go.jp/file/06-Seisakujouhou-12400000-Hokenkyoku/0000172084.pdf
- [6] Ministry of Health, Labour and Welfare, Patient Behavior Survey, Reiwa 5 (2023).
4.2 Medical Facilities and Hospital Beds
Classification of Medical Facilities
Medical facilities in Japan can be broadly classified into general clinics (with or without inpatient beds), dental clinics, and hospitals. Hospitals and clinics are distinguished on the basis of the number of beds: medical institutions with 20 or more beds are categorized as hospitals, while those with 19 beds or fewer, or without inpatient facilities, are classified as clinics. As of 2024, Japan has 8,060 hospitals, 5,415 clinics with inpatient beds, 99,792 clinics without inpatient beds, and 66,378 dental clinics. An examination of recent trends indicates that the number of hospitals and clinics with inpatient beds has been gradually declining, whereas clinics without inpatient beds have shown an increasing trend.[7]
With regard to hospitals, there also exists a functional classification system. Specifically, hospitals are categorized into three types: Community Healthcare Support Hospitals, Advanced Treatment Hospitals, and Core Clinical Research Hospitals. These institutions are respectively expected to fulfil key roles in ensuring regional healthcare provision, delivering advanced medical care as well as developing medical technologies and providing medical training, and serving as central hubs for the conduct of clinical research. In contrast to general hospitals that do not fall under these categories, these three types of hospitals are subject to distinct requirements, including specific staffing standards and organizational criteria.[8]
Classification of Hospital Beds
Hospital beds in Japan are categorized into general beds, long-term care beds, psychiatric beds, infectious disease beds, and tuberculosis beds.[9] Staffing standards differ according to each bed category, reflecting the varying levels of care and medical needs associated with each type.
With regard to bed classification, the Fourth Amendment to the Medical Care Act in 2000 introduced a significant reform by subdividing the former category of “other beds” into long-term care beds and general beds, with the aim of ensuring that medical care is more appropriately aligned with patients’ clinical conditions. As illustrated in Figure 4-2-3, general beds constitute the largest proportion among all bed categories.
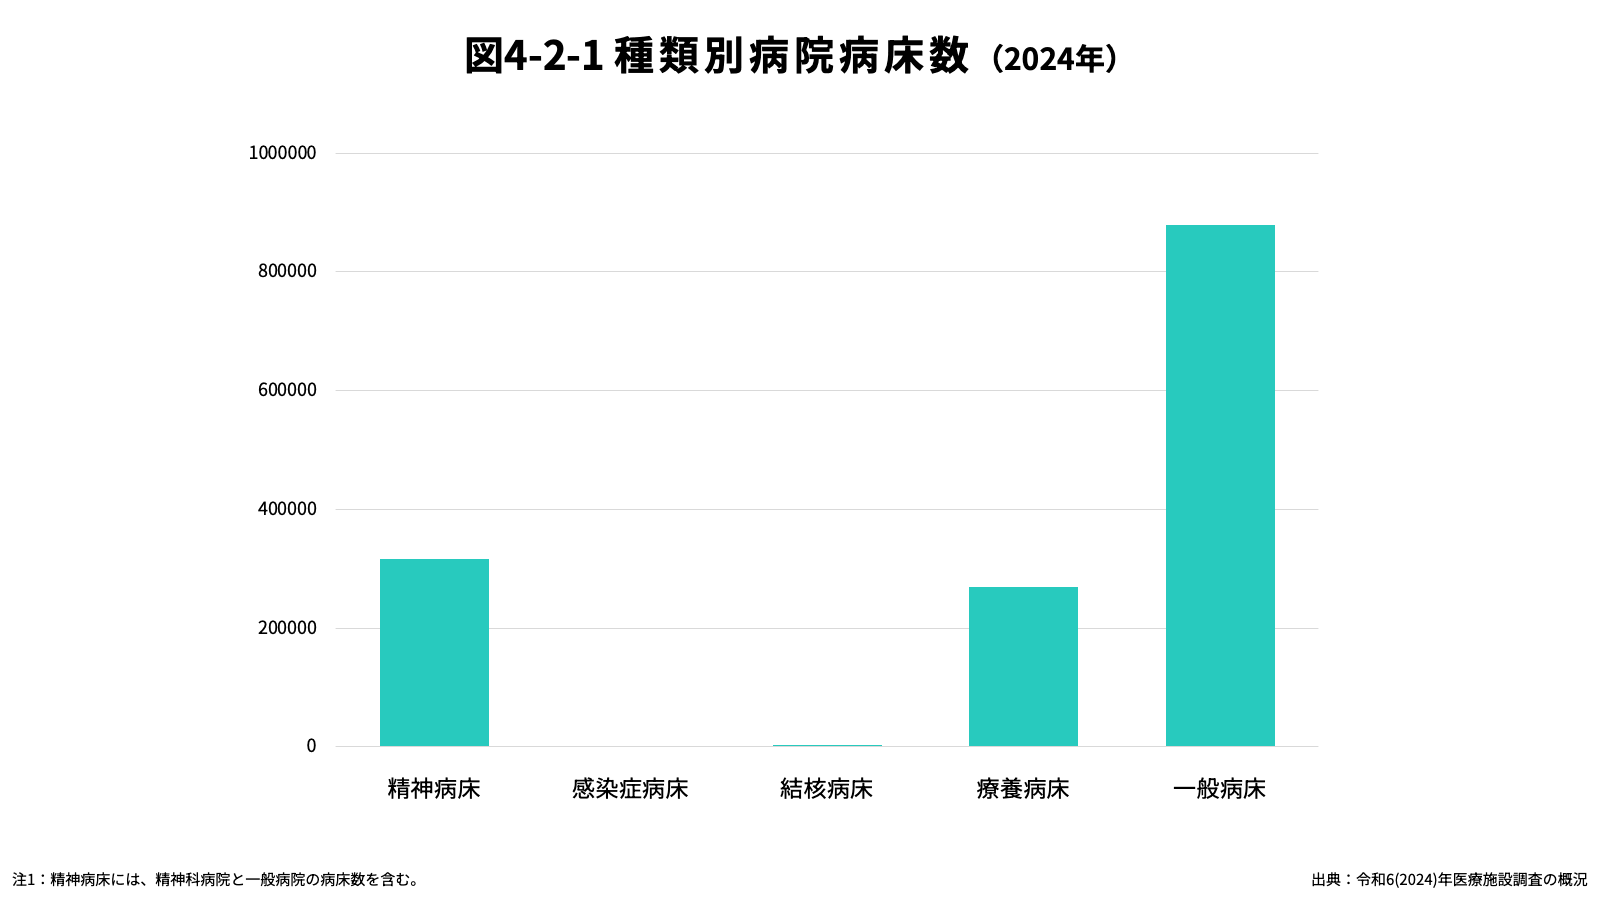
The trends observed in general hospital beds can be understood against the backdrop of policies implemented following the achievement of universal health insurance coverage. Measures to reduce patients’ financial burden, such as the introduction of the High-Cost Medical Expense Benefit system, led to an expansion in public demand for medical care, which in turn was accompanied by an increase in the number of hospitals and hospital beds.[10] Within this context, a significant number of patients occupying general beds are those unable to be discharged despite no longer requiring acute medical care, often due to difficulties in managing daily life after returning home. This phenomenon, commonly referred to as “social hospitalization,” has contributed to the sustained utilization of general hospital beds.
It has been widely noted that all members of the baby boom generation (born between 1947 and 1949) will reach the stage of advanced old age by around 2025, leading to a sharp increase in social security expenditures, including healthcare and long-term care costs. As population ageing continues to accelerate, there is a growing need to utilize limited healthcare resources more efficiently. In response, the government has set a target of reducing the total number of hospital beds to between 1.15 and 1.19 million by 2025. This policy aims to promote the functional differentiation of hospital beds according to the nature of medical needs, ensuring that patients can receive appropriate care, in appropriate settings, and at appropriate times across all regions.[11]
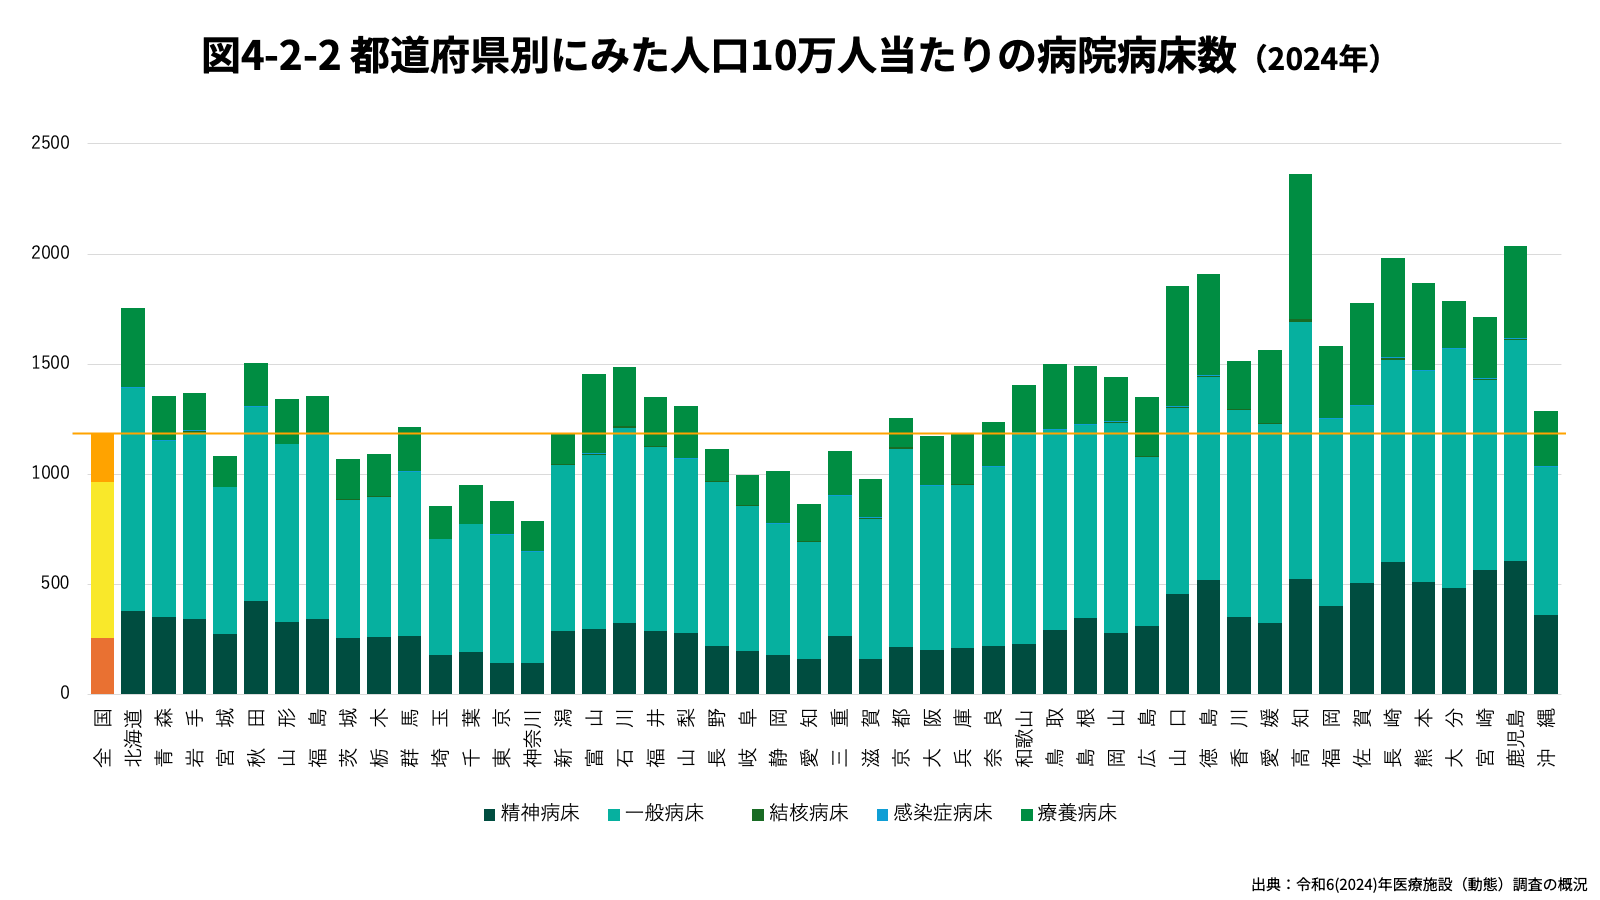
An examination of hospital bed numbers by prefecture reveals substantial regional disparities, as illustrated in Figure 4-2-4. The difference in the number of hospital beds per 100,000 population between Kochi Prefecture, which has the highest number, and Kanagawa Prefecture, which has the lowest, is approximately threefold. It is expected that such regional disparities will be addressed through the development and implementation of Regional Healthcare Plans (see Section 4.4). Under this framework, prefectures report the medical functions of hospital beds to the prefectural governor, and based on these reports, aim to realize an optimal future healthcare delivery system by determining the required volume of each medical function in line with regional needs.
- [7] Ministry of Health, Labour and Welfare, Survey of Medical Institutions. https://www.mhlw.go.jp/toukei/saikin/hw/iryosd/24/dl/02sisetu06.pdf
- [8] Ministry of Health, Labour and Welfare, Annual Health, Labour and Welfare Report 2017 (Heisei 29 Edition). http://www.mhlw.go.jp/wp/hakusyo/kousei/17-2/dl/02.pdf
- [9] Ministry of Health, Labour and Welfare, Annual Health, Labour and Welfare Report 2017 (Heisei 29 Edition). http://www.mhlw.go.jp/wp/hakusyo/kousei/17-2/dl/02.pdf
- [10] National Federation of Health Insurance Societies (2017), Medical Security in Figures: 2017 Edition, Gyōsei Publishing, p. 43.
- [11] Ministry of Health, Labour and Welfare, Materials from the National Conference of Directors of Health, Labour and Welfare Bureaux. http://www.mhlw.go.jp/topics/2016/01/dl/tp0115-1-03-01p.pdf
4.3 Healthcare Professionals
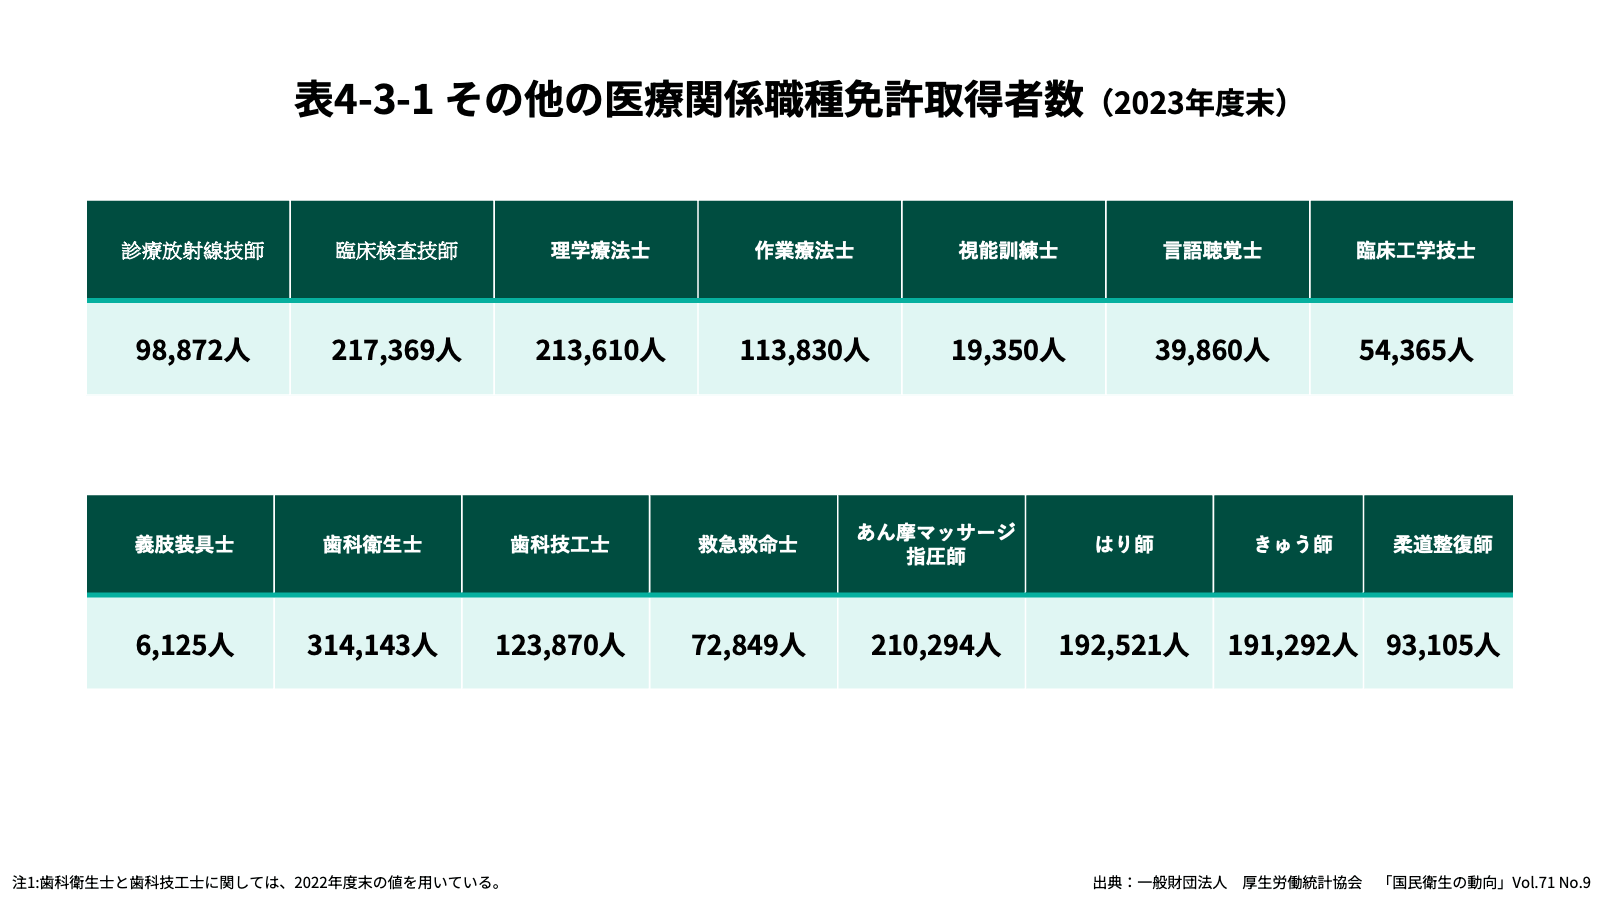
In Japan, a wide range of occupations related to the provision of medical care are regulated through statutory qualification systems. For many healthcare professions, the law establishes either exclusive scope of practice, whereby only individuals holding the relevant national qualification are permitted to perform specified professional duties, or exclusive use of professional titles, whereby individuals are prohibited from using a designated professional title, or similar titles, unless they hold the appropriate qualification.
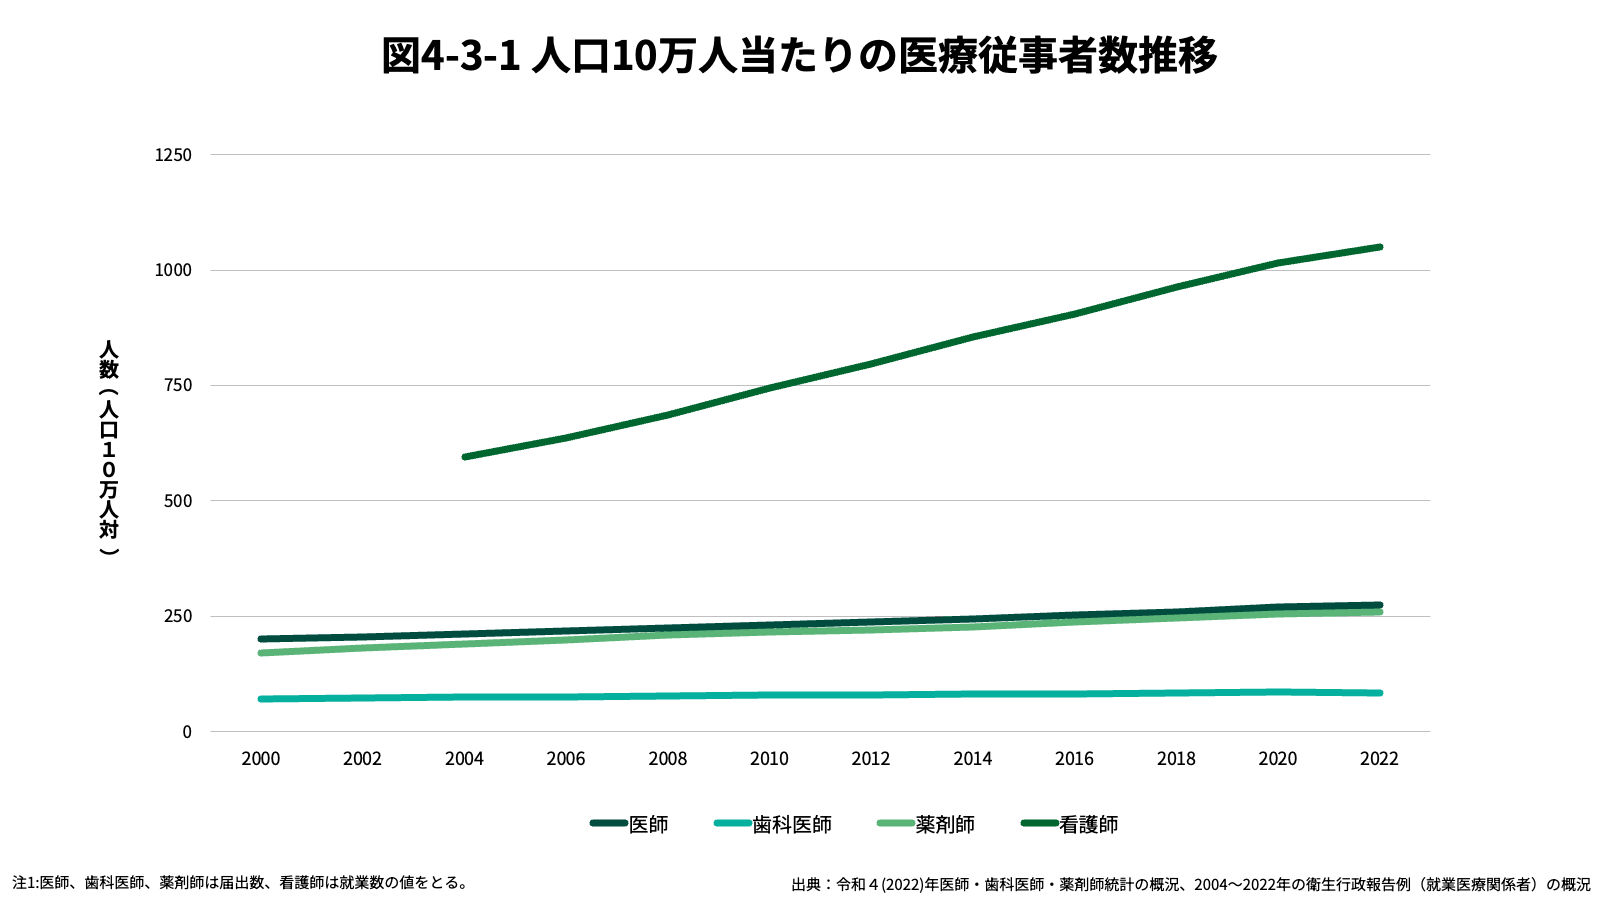
This section focuses in particular on four core healthcare professions: physicians, dentists, pharmacists, and nurses, and examines their roles and regulatory frameworks in greater detail.
Physicians
The total number of registered physicians nationwide has continued to increase steadily, reaching 343,275 as of 2022. At the same time, substantial disparities can be observed among prefectures: physician density tends to be higher in western Japan, while regions in and north of the Kanto area generally have fewer physicians. In addition, it has been noted that the average age of physicians has been rising in recent years. In particular, the average age of physicians working in clinics reached 60.4 years in 2022. Excluding clinical trainees, the distribution of physicians by primary specialty (with one specialty assigned per physician) shows that internal medicine is the most common, followed by orthopedics and pediatrics.[12]
In recent years, the uneven geographical distribution of physicians and imbalances across medical specialties have emerged as major policy challenges, prompting a range of countermeasures. At the prefectural level, initiatives have included increasing medical school enrolment quotas through regional admission programs and strengthening support through Regional Healthcare Support Centers. In addition, ceiling limits have been introduced in prefectures and specialties where the number of physicians exceeds estimated demand.
Concerns have also been raised regarding the specialist certification system, as it had previously been administered independently by individual academic societies, leading to issues related to consistency in certification standards and the assurance of specialist quality. In response, a new specialist training system was established with the aim of improving the quality of specialists and ensuring the provision of high-quality medical care. This reform introduced a new framework centered on a neutral third-party organization responsible for the unified certification of specialists and the evaluation and accreditation of training programs. The system was fully implemented nationwide in 2018.[13]
From 2024, the “Physicians’ Work Style Reform” was launched. This policy aims to address longstanding practices of excessive working hours among physicians and to ensure the sustainable provision of high-quality and safe medical care for patients. Under this reform, upper limits on overtime work have been introduced, stipulating in principle that physicians’ annual overtime hours should not exceed 960 hours, while allowing for special exemption categories under specific conditions.[14]
Dentists
The total number of registered dentists nationwide has remained relatively stable in recent years, reaching 105,267 as of 2022. A notable characteristic of the dental workforce is that an overwhelming majority of dentists, over 85 per cent, are employed in dental clinics rather than in hospital settings. There are also substantial inter-prefectural disparities in the distribution of dentists. For example, when measured per 100,000 population, Tokyo, which has the highest density, has approximately twice as many dentists as Aomori Prefecture, which has the lowest. In addition, the average age of dentists has been rising steadily, indicating a progressing ageing of the dental workforce.[15]
Pharmacists
The number of registered pharmacists nationwide has continued to increase steadily, reaching 323,690 as of 2022. Pharmacists employed in community pharmacies account for the largest share, at approximately 60 per cent of the total workforce. In terms of age distribution, pharmacists aged 30–39 constitute the largest cohort. Regional disparities are also evident: prefectures such as Tokushima, Hyogo, and Tokyo have relatively high numbers of pharmacists, whereas Okinawa, Fukui, and Aomori have comparatively fewer.[16]
Pharmacists are employed across a wide range of settings, including hospitals and community pharmacies where they are engaged in dispensing, as well as in pharmaceutical companies and pharmaceutical distribution. Looking ahead, however, pharmacists are expected to assume new and expanded roles. A government policy summary released in July 2022 emphasized that, amid rapidly growing healthcare needs and increasing difficulties in securing sufficient healthcare personnel, community pharmacists are expected to play a vital role in supporting the Community-based Integrated Care System. Specifically, the policy highlighted the importance of strengthening patient-facing services, improving the efficiency of dispensing and other product-focused tasks, responding to digitalization and the use of information and communication technologies (ICT), and ensuring that pharmacies collectively provide services tailored to the needs of their local communities.
Nursing Personnel and Related Professions
Nursing personnel include not only nurses, but also public health nurses, midwives, and assistant nurses, each of whom follows a distinct training pathway. The total number of nursing personnel has shown a consistent upward trend over time. While hospitals and clinics remain the primary workplaces, recent years have seen particularly high growth in employment within home-visit nursing stations and long-term care insurance facilities.[17]
Approximately 90 per cent of nursing personnel are women, and many experience career interruptions due to childbirth, childrearing, or caregiving responsibilities. As a result, measures to support re-employment, promote workforce retention, and prevent attrition have been actively implemented. Moreover, as population ageing accelerates and the working-age population declines sharply, demand for nursing care is expected to increase further. Consequently, challenges include not only addressing potential shortages in the overall number of nursing personnel, but also correcting geographical imbalances and facilitating shifts from hospital-based employment to home-visit nursing and long-term care settings.
Among nursing personnel, nurses constitute the largest group, numbering 1,311,687 as of 2022. In terms of employment settings, hospitals account for the largest share, followed by clinics and long-term care insurance facilities. The Japanese Nursing Association has established three professional certification systems, Certified Nurse Specialist, Certified Nurse, and Certified Nurse Administrator, to promote the development of highly specialized and advanced nursing professionals.
In addition, since 2015, a training system for nurses authorized to perform specified medical acts has been in place. This program aims to train nurses who can carry out certain medical support activities based on standardized protocols without waiting for direct instructions from physicians or dentists. This initiative is expected to contribute to task shifting and task sharing in the context of physicians’ work style reform, as well as to support the expansion of home-based medical care.
In recent years, Japan has also expanded the acceptance of foreign nurses under frameworks such as Economic Partnership Agreements (EPAs) and the Technical Intern Training Program. Nurse candidates are currently accepted from three countries, Indonesia, the Philippines, and Viet Nam, reflecting efforts to address workforce needs while promoting international cooperation in healthcare.
Gender Distribution among Healthcare Professionals
The gender balance among healthcare professionals in Japan remains markedly uneven. As of 2022, 76.4 per cent of physicians were male. Although the proportion of female physicians has been increasing in recent years, women continue to be underrepresented overall. A generational shift is nevertheless evident: while women account for only 20.9 per cent of physicians in the 50–59 age group, their share rises to 36.2 per cent among those aged 29 and under.
In contrast, women constitute the majority of pharmacists and nurses. Specifically, women accounted for 61.6 per cent of pharmacists and as many as 91.4 per cent of nurses in 2022, highlighting a pronounced gendered division of labor across healthcare professions in Japan.
- [12] Ministry of Health, Labour and Welfare. Overview of the 2022 (Reiwa 4) Survey of Physicians, Dentists and Pharmacists. https://www.mhlw.go.jp/toukei/saikin/hw/ishi/22/dl/R04_kekka-1.pdf
- [13] Ministry of Health, Labour and Welfare. 2. Measures to Address the Maldistribution of Physicians. http://www.mhlw.go.jp/file/05-Shingikai-12601000-Seisakutoukatsukan-Sanjikanshitsu_Shakaihoshoutantou/0000184302.pdf
- [14] Ministry of Health, Labour and Welfare. Work Style Reform for Physicians. https://www.mhlw.go.jp/content/10800000/001129457.pdf
- [15] Ministry of Health, Labour and Welfare. Overview of the 2022 (Reiwa 4) Survey of Physicians, Dentists and Pharmacists. https://www.mhlw.go.jp/toukei/saikin/hw/ishi/22/dl/R04_kekka-1.pdf
- [16] Ministry of Health, Labour and Welfare. Overview of the 2022 (Reiwa 4) Survey of Physicians, Dentists and Pharmacists. https://www.mhlw.go.jp/toukei/saikin/hw/ishi/22/dl/R04_kekka-1.pdf
- [17] Ministry of Health, Labour and Welfare. The Current Situation Surrounding the Securing of Nurses and Other Nursing Personnel. https://www.mhlw.go.jp/content/10800000/001118192.pdf
4.4 Planning of Regional Healthcare Provision
As Japan’s healthcare delivery system is predominantly centered on the private sector, various initiatives have been implemented, led primarily by prefectural governments, to ensure coordination among medical institutions and to establish an efficient and high-quality healthcare delivery system. To this end, geographical units known as medical service areas have been designated, within which regional healthcare planning and coordination are undertaken. Among these, the secondary medical service area constitutes a particularly important unit.
A secondary medical service area is defined by prefectural governments as a geographical unit within which it is considered appropriate to provide inpatient medical care through hospitals and clinics as an integrated system. As of April 2024, there are 330 such medical service areas nationwide. In recent years, significant regional disparities in population structure and the distribution of healthcare resources have become increasingly evident. As a result, initiatives undertaken at the prefectural and medical service area levels play a crucial role in designing healthcare delivery systems that are responsive to local conditions, as well as in strengthening coordination between healthcare and long-term care services.
At the national level, the government supports these efforts by presenting uniform indicators applicable across the country and by setting out detailed requirements for the formulation of medical care plans, thereby providing a common analytical and planning framework for prefectures. Specific initiatives undertaken within this framework are outlined below.
Medical Care Plans
Medical care plans were established through the 1985 amendment to the Medical Care Act with the aim of promoting the development of regional healthcare delivery systems and ensuring the efficient utilization of medical resources. As population structures and the availability of healthcare resources vary significantly across regions, each prefecture formulates its own medical care plan in line with local circumstances. The objective of these plans is to promote the appropriate functional differentiation and coordination of medical services within each region, and to establish a seamless system through which necessary healthcare can be provided continuously across the community.
The contents of medical care plans include targets to be achieved with respect to five priority diseases; cancer, stroke, cardiovascular diseases, diabetes, and mental disorders, and six priority healthcare services, including emergency medical care and medical services provided during disasters (including periods of infectious disease outbreaks such as emerging infections), as well as home-based medical care. In addition, the plans specify healthcare coordination frameworks, measures to secure healthcare personnel, strategies for providing information to residents, initiatives to ensure patient safety, the designation of secondary and tertiary medical service areas, and the calculation of standard numbers of hospital beds. These contents are reviewed periodically in accordance with amendments to the Medical Care Act and related policy reform.
Regional Healthcare Vision[18]
In anticipation of 2025, when the baby boom generation will reach the age of 75 and above and healthcare and long-term care expenditures are expected to rise sharply, the formulation of a Regional Healthcare Vision was mandated from 2018 as a component of prefectural medical care plans. The purpose of this initiative is to establish high-quality and efficient healthcare delivery systems tailored to regional needs. Under this framework, prefectures are required to estimate future healthcare demand and the required number of hospital beds by 2025 for each planning area and for each of four functional categories: highly acute care, acute care, recovery care, and chronic care. Based on these estimates, prefectures are expected to develop concrete policy measures.
The planning areas used for Regional Healthcare Visions are, in principle, based on existing secondary medical service areas, but are defined with consideration given to changes in population structure, trends in healthcare demand, and the distribution of healthcare professionals and medical institutions. The Regional Healthcare Vision specifies projected healthcare demand in 2025 (including inpatient and outpatient demand and disease-specific patient numbers), the desired future configuration of healthcare delivery systems (including the required volume of medical functions by secondary medical service area), and the measures necessary to realize this vision.
Following formulation, prefectures are required to convene Regional Healthcare Vision Coordination Meetings on an ongoing basis within each planning area. These meetings bring together healthcare providers, health insurers, and other relevant stakeholders to discuss: (1) concrete response policies for individual medical institutions; (2) measures for medical institutions with wards in which all beds are not fully utilized; and (3) responses to the establishment of new medical institutions or increases in bed numbers.
Beyond 2025, a new Regional Healthcare Vision will be developed with a view towards around 2040, when the population aged 85 and over is expected to increase substantially while the working-age population declines. In addition to existing considerations, major challenges will include strengthening coordination between healthcare and long-term care services and reassessing the overall structure of regional healthcare delivery systems, including the roles of primary care physicians and home-based medical care.
Physician Supply Plan
The 2018 amendment to the Medical Care Act also introduced the requirement to formulate Physician Supply Plans in order to secure healthcare provision at the regional level by addressing geographical disparities in physician distribution. Under this framework, prefectures use physician maldistribution indicators to classify secondary medical service areas into physician-shortage areas and physician-surplus areas, and implement physician supply measures accordingly.
In physician-shortage areas, defined as those falling within the lowest 33.3 per cent according to the maldistribution indicator, prefectures set target numbers of physicians and implement measures to achieve these targets. These measures include coordinating physician placements, developing career formation programs, and establishing regional admission quotas and local origin quotas in medical schools.[19] Conversely, areas classified as physician-surplus areas, those in the highest 33.3 per cent are, in principle, not permitted to recruit physicians from other medical service areas, and may instead dispatch physicians to shortage areas as necessary.[20]
Outpatient Care Plan
With respect to outpatient care, the 2018 amendment to the Medical Care Act mandated the formulation of Outpatient Care Plans by each prefecture in order to address issues such as increasing sub-specialization and the concentration of clinics without inpatient beds in urban areas. Prefectures use outpatient physician maldistribution indicators to designate outpatient physician-surplus areas and incorporate into their plans measures such as information provision to new clinic entrants, the establishment of consultation forums on outpatient care, plans for the efficient use of medical equipment, and assessments of regional outpatient care provision.[21]
Furthermore, the Outpatient Function Reporting System was introduced in 2022. Based on the outcomes of this reporting process and subsequent consultations, medical institutions that reach agreement with relevant stakeholders are publicly designated as Referral-based Priority Medical Institutions. These institutions specialize in providing outpatient care to patients referred with formal referral letters. Patients who attend such institutions without a referral are required to pay an additional charge (designated medical expense) on top of the standard 30 per cent patient co-payment. This policy is expected to contribute to shorter waiting times for outpatient consultations and to reduce the workload of hospital-based physicians.[22]
- [18] Health, Labour and Welfare Statistics Association (General Incorporated Foundation). Trends in National Health, Vol. 71, No. 9, 2024/2025.
- [19] Health, Labour and Welfare Statistics Association (General Incorporated Foundation). Trends in National Health, Vol. 71, No. 9, 2024/2025.
- [20] Ministry of Health, Labour and Welfare. Guidelines for the Formulation of Physician Recruitment Plans: The Eighth Medical Care Plan (First Phase). https://www.mhlw.go.jp/content/001083986.pdf
- [21] Health, Labour and Welfare Statistics Association (General Incorporated Foundation). Trends in National Health, Vol. 71, No. 9, 2024/2025.
- [22] Ministry of Health, Labour and Welfare. On Referral-Based Core Medical Institutions. https://www.mhlw.go.jp/stf/seisakunitsuite/bunya/0000123022_00003.html