

6.1 Background
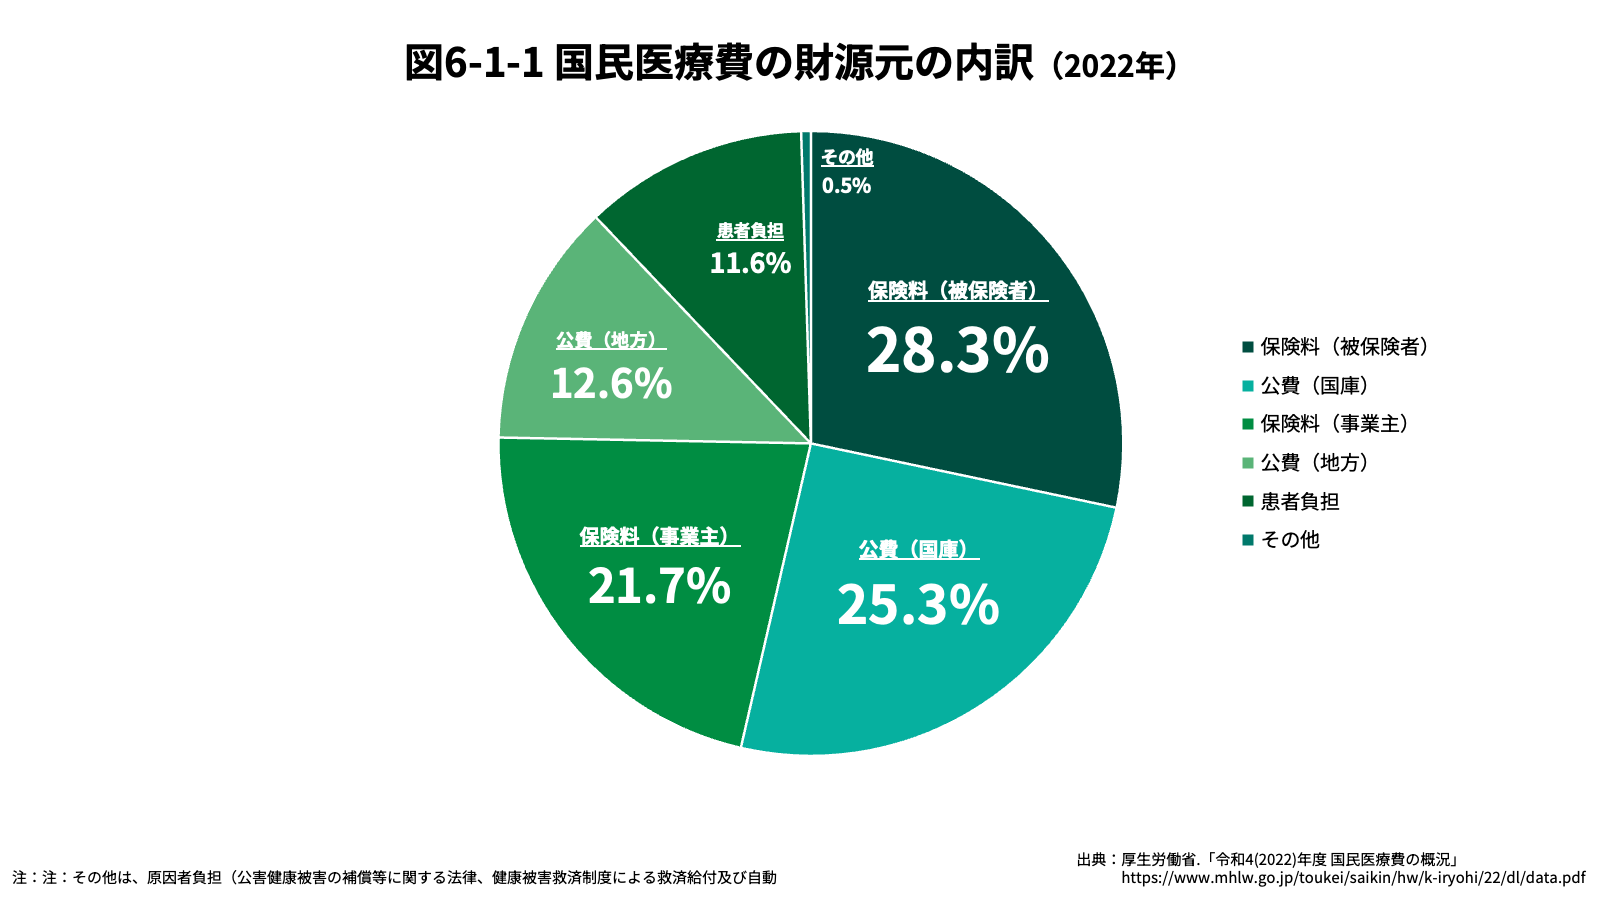
First, we consider the background context in which the budgeting (expenditure control) of medical costs in Japan has become necessary. Japan’s public healthcare system is nominally based on a social insurance model; however, in practice, approximately 40 per cent of national medical expenditure is financed through taxation, amounting to over ¥15 trillion in total spending. Of this, the ratio between central and local government contributions is roughly 2:1.
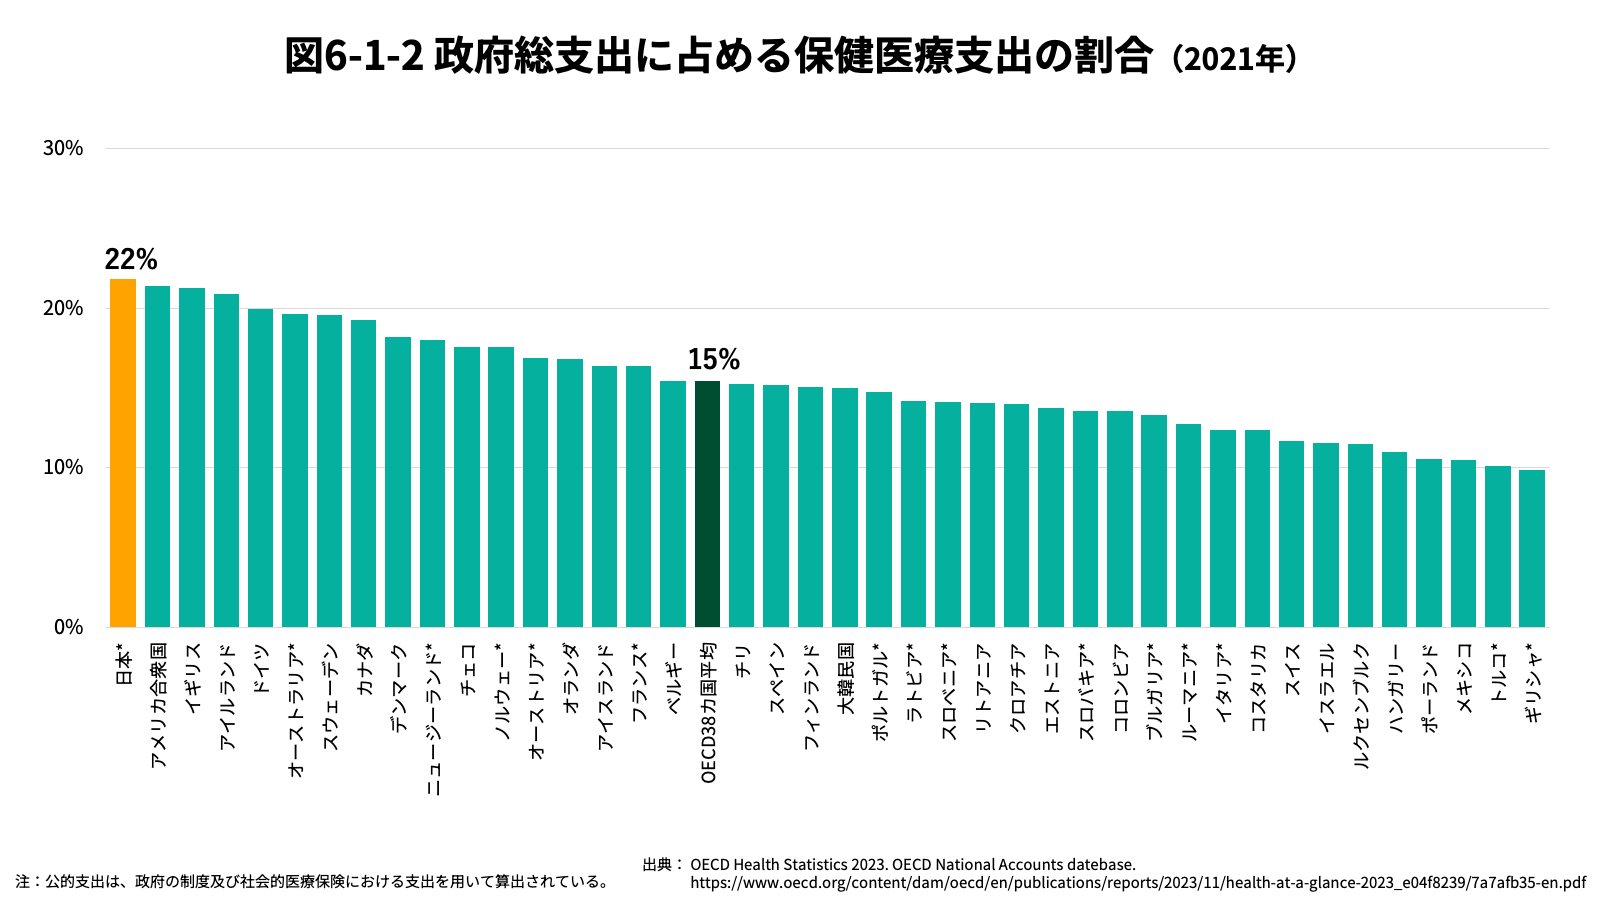
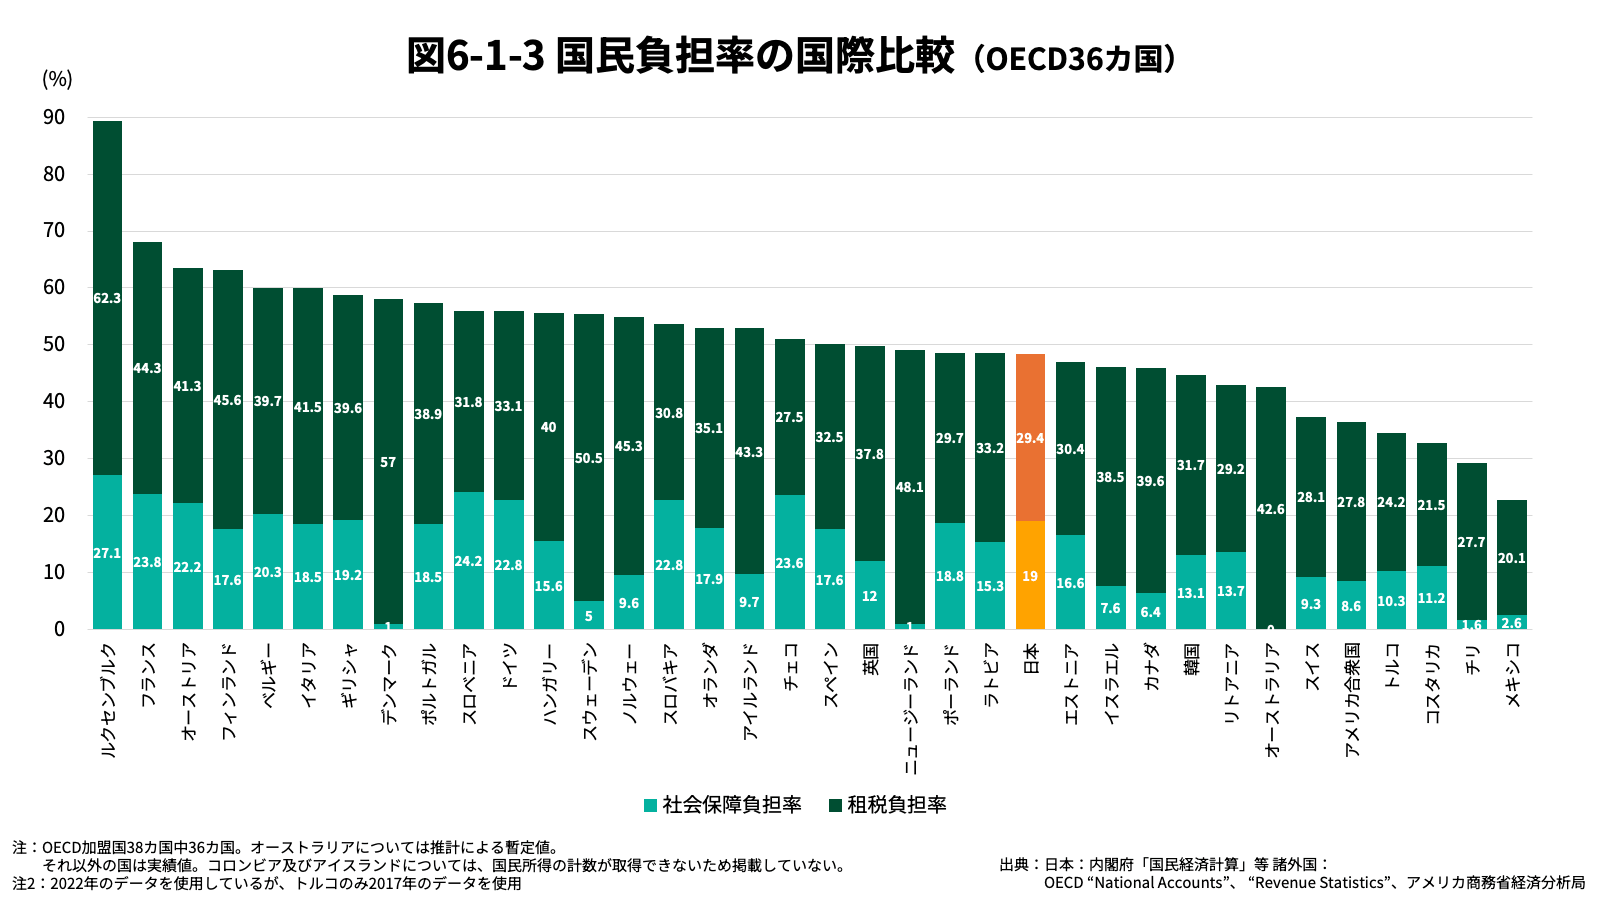
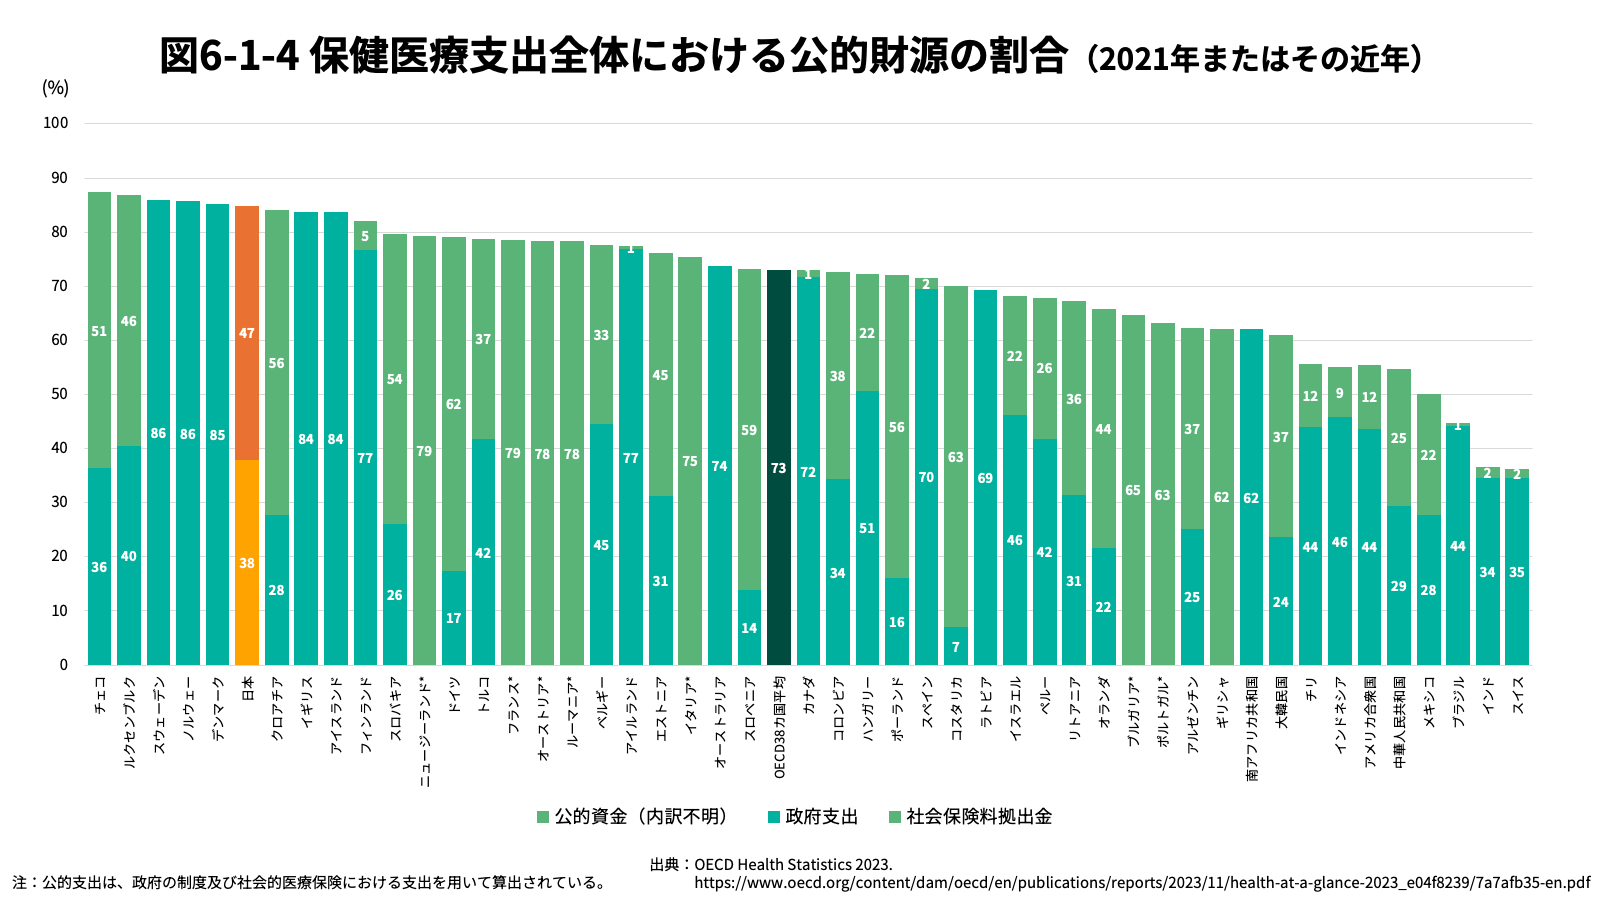
The significant share of healthcare costs within government budgets constitutes one of the key drivers of the strong demand for expenditure control in Japan. The level of public health expenditure as a proportion of total government spending is the highest among OECD member states. Whilst this does, in one sense, reflect the elevated level of healthcare expenditure, it is important to note that other factors also warrant consideration. The first is the comparatively small size of Japan’s government. Japan’s national burden rate remains modest by international standards, even after accounting for the fiscal deficit, meaning that healthcare expenditure commands a disproportionately large share of a relatively constrained national budget. The second factor is the high proportion of public expenditure within total healthcare spending. In certain other countries, rather than a directly government-provided system such as the United Kingdom’s National Health Service or Japan’s social insurance model, there exist mechanisms that legally mandate enrolment in private health insurance. As a consequence, even where total healthcare expenditure is high, the share of such expenditure within government budgets may be comparatively low.
It should be noted that multiple indicators exist for measuring healthcare expenditure, and care must be taken in their application. “National Medical Expenditure” (Kokumin Iryohi) is an estimate of the costs incurred at medical institutions for the treatment of illnesses and injuries covered under public health insurance within a given financial year; it does not encompass medical procedures not covered by insurance, nor supplementary room charges. “Total Health Expenditure” (So Hoken Iryo Shishutsu), by contrast, is an indicator calculated on the basis of the OECD System of Health Accounts (SHA) methodology, designed to capture comprehensively all domestic expenditure on health and medical care. Specifically, it includes a portion of long-term care expenditure, payments from private health insurance, maternity and delivery costs, and preventive care expenditure, in addition to medical costs. National Medical Expenditure is a government statistical measure of high reliability and is frequently used domestically as an indicator of social security spending; however, as it is based on Japan-specific criteria, its comparability across international contexts is limited. Total Health Expenditure, being based on international standards, offers comparatively greater scope for international comparison, though its estimation methodology remains under development and its calculation process lacks full transparency. In this chapter, Total Health Expenditure is used where international comparisons are made; in all other cases, National Medical Expenditure is employed as the principal indicator.
Back to Contents6.2 Macro Level 1
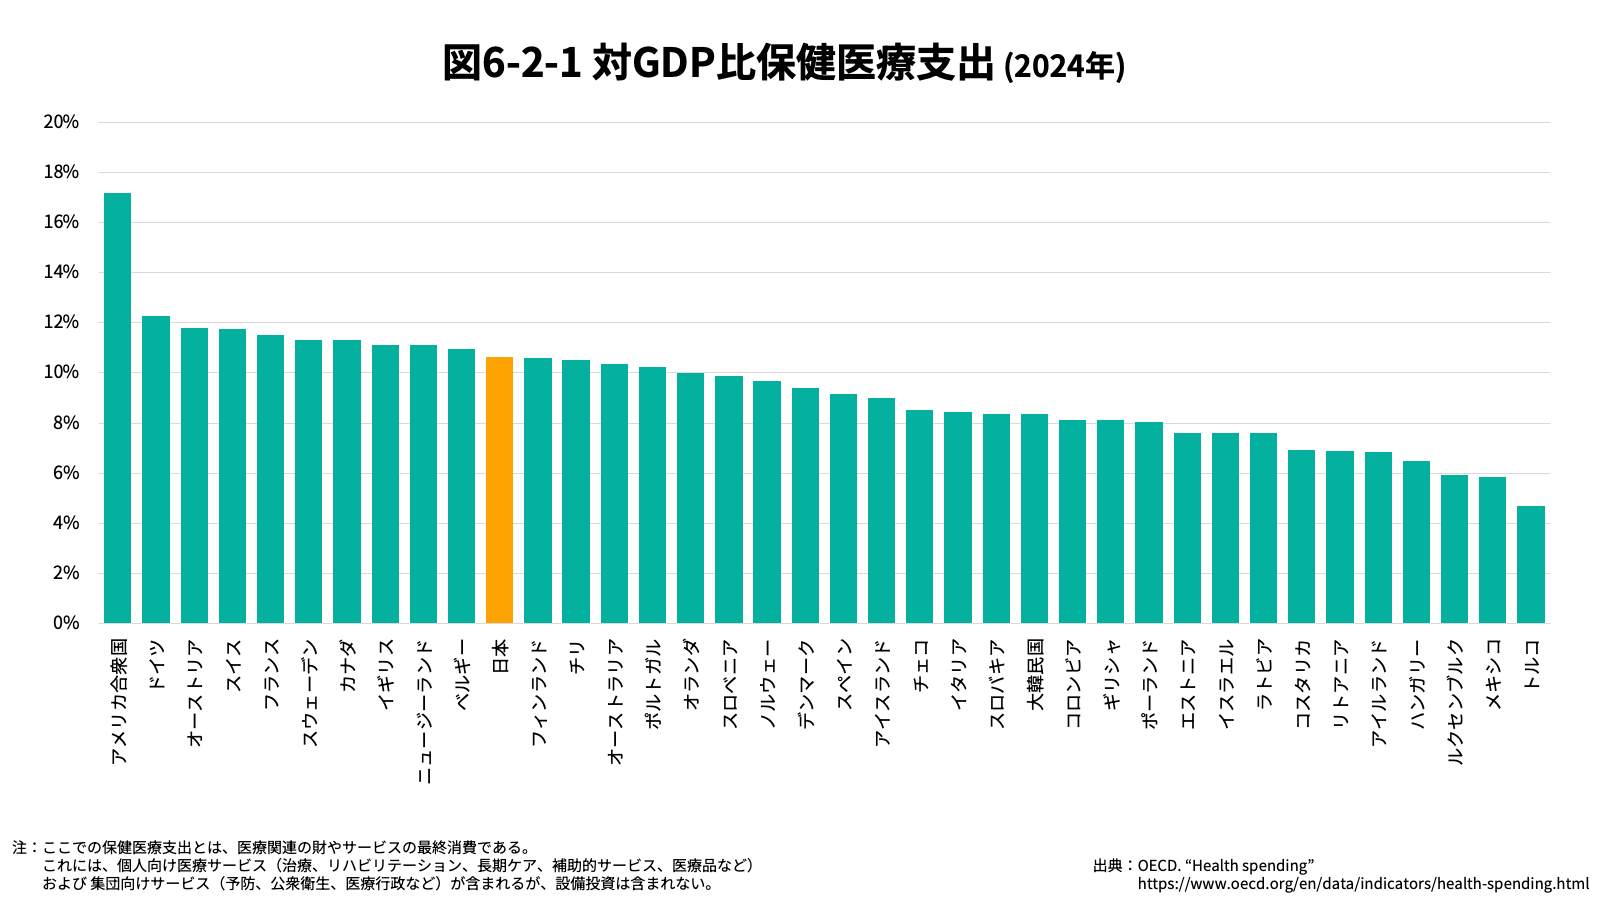
This section examines overall trends in Japan’s national medical expenditure. As of 2024, Japan’s total health expenditure as a proportion of GDP stands at approximately 10.6 per cent, placing Japan eleventh globally. Among other countries, the United States is a considerable outlier at 17.2 per cent, while most other high-ranking nations cluster above the 10 per cent mark.[1] In the United States, in particular, a marked increase has been observed since the 1980s. Furthermore, at a global level, a long-term upward trend in total health expenditure as a proportion of GDP is discernible. It should be noted that the OECD Health Statistics indicator is broader in scope than National Medical Expenditure, encompassing over-the-counter medicines, long-term care services, preventive care (including vaccinations and health check-ups), natural deliveries, and supplementary room charges.
Factors Driving Growth in National Medical Expenditure
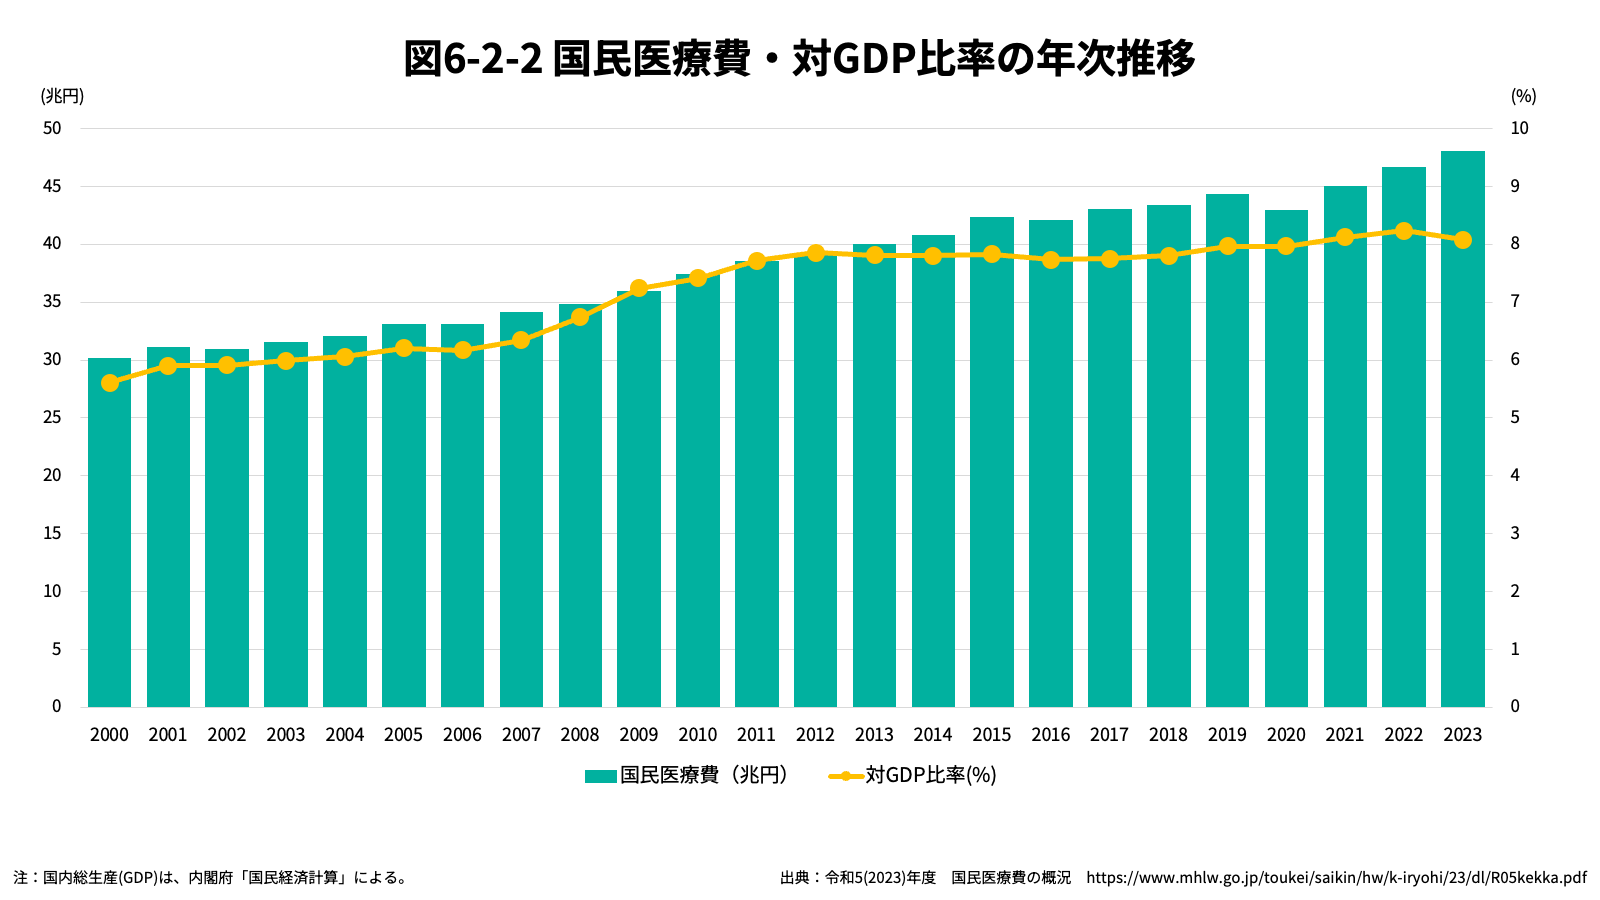
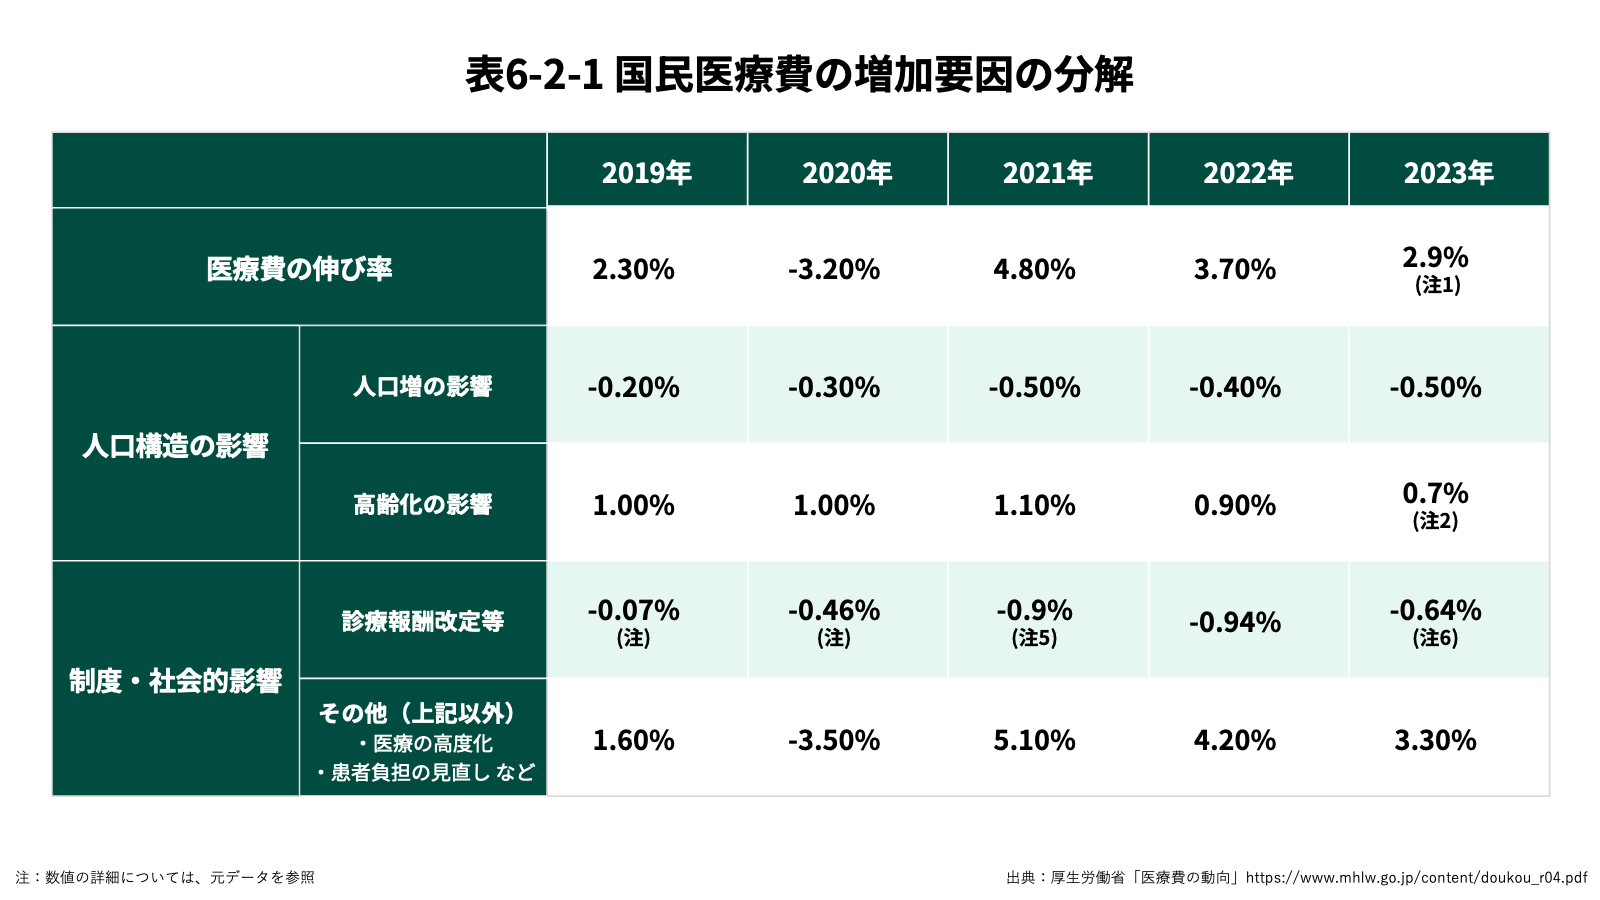
As the figures demonstrate, national medical expenditure has increased year on year. The following table sets out trends in national medical expenditure over the most recent five-year period, together with a breakdown of contributing factors. These data indicate that healthcare costs have risen primarily as a result of population ageing and advances in medical technology. With respect to population ageing in particular, in 2022 approximately 60 per cent of national medical expenditure was attributable to individuals aged 65 and over[2] (who constituted approximately 29.0 per cent of the total population as of 1 October 2021).[3] On a per capita basis, national medical expenditure for those aged 65 and over is approximately four times that of those under 65. As the total population declines, the proportion of older people continues to rise; by 2037, it is projected that individuals aged 65 and over will account for 33.3 per cent of the population, meaning one in every three persons will be in this age group.[4] A further increase in national medical expenditure is therefore anticipated.
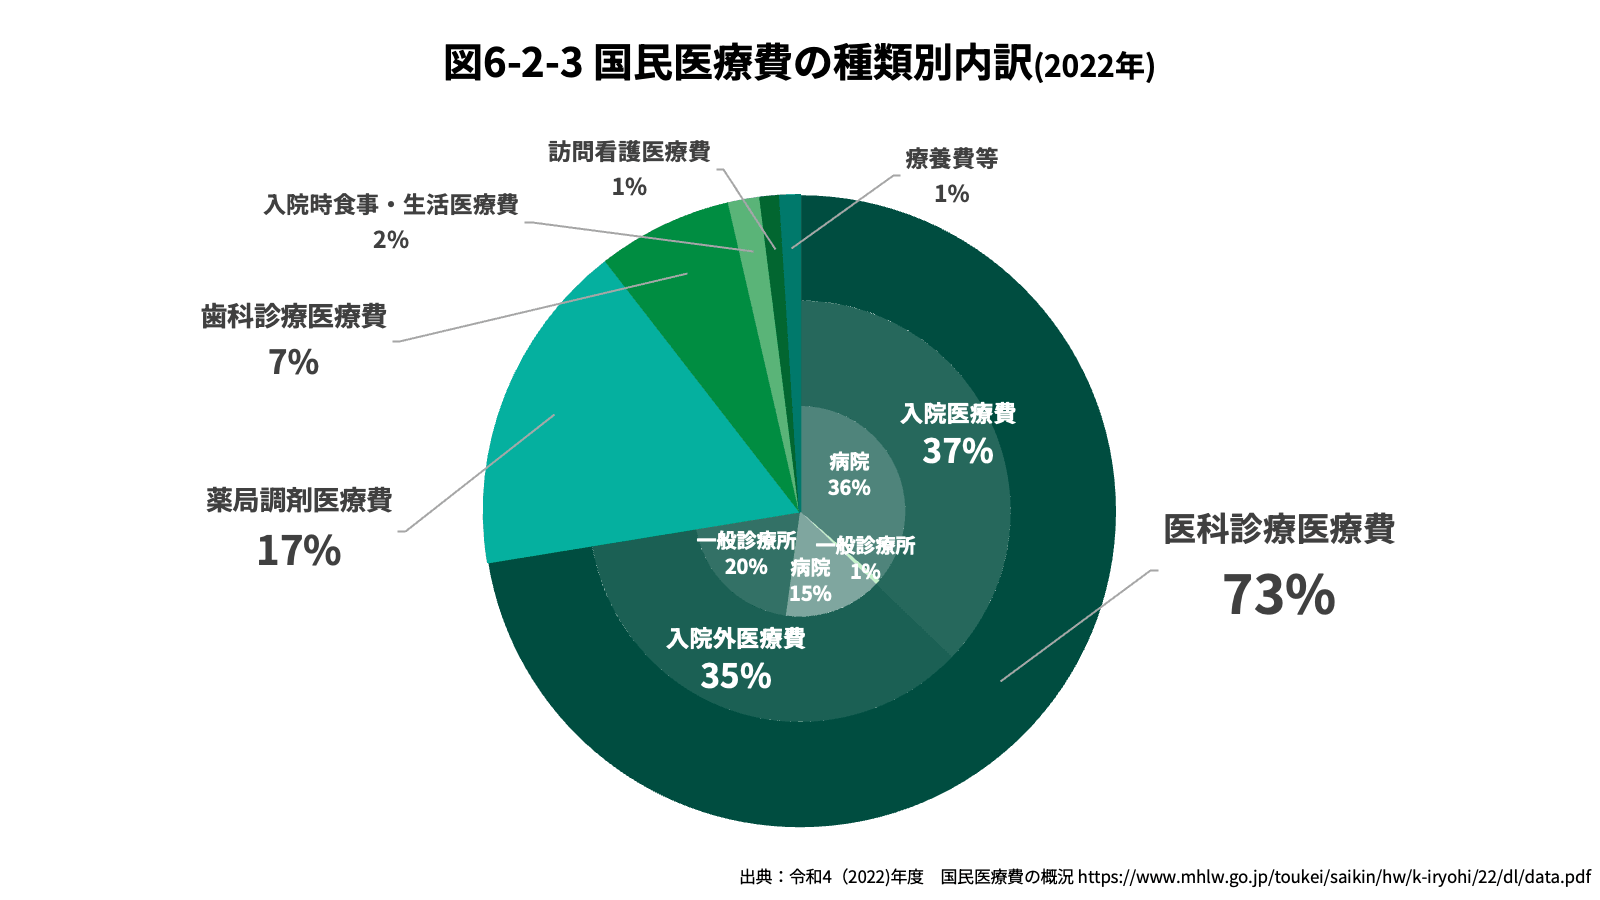
When national medical expenditure is further disaggregated by type of treatment, inpatient medical costs account for the largest share at approximately 37 per cent of total national medical expenditure, followed by outpatient medical costs at approximately 35 per cent, and pharmacy dispensing costs at approximately 17 per cent.[5] As noted in Section 4, the comparatively lengthy average length of hospital stay, when set against international comparators, has been identified as a structural factor contributing to the persistently elevated level of inpatient medical costs.
Aggregate Management of National Medical Expenditure
There is no mechanism in Japan for directly controlling the aggregate level of national medical expenditure. However, indirect management is exercised through the revision rate applied to fee schedules. This rate is an indicator that estimates the extent to which healthcare expenditure will increase as a result of biennial fee schedule revisions.
The revision rate R at a given point k is expressed by the following formula:
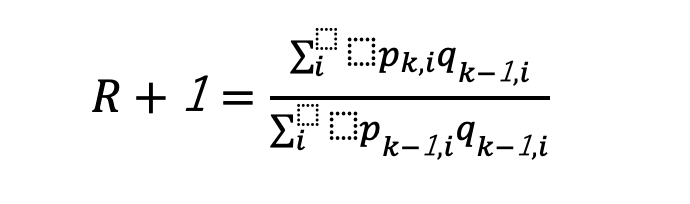
Here, for each individual fee schedule unit i (representing a specific medical procedure), p denotes the unit price and q the number of claims. In the calculation, p is updated to reflect the revised fee schedule, whilst q is held constant at the preceding period’s figure. The revision rate therefore represents the percentage change in expenditure following revision compared to pre-revision levels, assuming identical demand. Accordingly, even where the revision rate is zero per cent, expenditure may still increase due to the q component, for instance, through population ageing or increased consultation frequency.[6]
As noted in Section 2, the revision rate was, until the early 2000s, determined by the Central Social Insurance Medical Council (Chuikyo). It is now determined by the Cabinet, meaning that top-down aggregate management of total healthcare expenditure is exercised, albeit indirectly.
It should be noted, however, that the aggregate level of healthcare expenditure also results from the bottom-up accumulation of individual medical acts. Excessive top-down management therefore risks rendering healthcare institutions financially unviable. Aggregate expenditure is thus managed within the competing pressures of national fiscal conditions and the financial sustainability of medical institutions.
- [1] OECD. 2024. “Health spending: OECD Indicators.” https://www.oecd.org/en/data/indicators/health-spending.html
- [2] Cabinet Office. “Overview of National Medical Expenditure, FY2022.” https://www.mhlw.go.jp/toukei/saikin/hw/k-iryohi/22/dl/data.pdf
- [3] Cabinet Office. “White Paper on the Elderly, FY2023.” https://www8.cao.go.jp/kourei/whitepaper/w-2023/zenbun/pdf/1s1s_01.pdf
- [4] Cabinet Office. “White Paper on the Elderly, FY2025.” https://www8.cao.go.jp/kourei/whitepaper/w-2025/zenbun/pdf/1s1s_01.pdf
- [5] Ministry of Health, Labour and Welfare. “Overview of National Medical Expenditure, FY2022.” https://www.mhlw.go.jp/toukei/saikin/hw/k-iryohi/22/dl/data.pdf
- [6] Endo, Hisao. “The Process of Determining Fee Schedules.” Journal of the Japanese Society of Internal Medicine, Vol. 103, No. 12, pp. 2892–2898.
6.3 Macro Level 2: Financial Management of Medical Institutions
The patient co-payments collected by medical institutions, together with the balance of fees claimed through and reimbursed by claims review bodies, constitute the revenue of those institutions. Fee schedule reimbursements do not accrue directly as physician income; rather, in the case of clinics and hospitals, they must cover personnel costs for physicians and nurses, expenditure on pharmaceuticals and medical materials, and the costs of maintaining facilities.
Key Statistical Data on Medical Institutions
The Survey of Medical Economic Conditions (Iryo Keizai Jittai Chosa), conducted by the MHLW clarifies the operational and financial conditions of hospitals, general clinics, dental clinics, and dispensing pharmacies. Conducted biennially, it serves as fundamental reference material for the next fee schedule revision. It should be noted that direct comparison between pre-revision conditions across survey cycles is not possible, as the cohort of surveyed institutions changes; furthermore, as a sample survey, the composition of respondents may diverge from the actual distribution of medical institutions.
The profit/loss margin rate by institution type and operator is presented in Figure 6-3-1. In FY2022, the profit/loss rate for general hospitals, excluding COVID-related subsidies, stood at −6.7 per cent across all general hospitals (including public institutions), and at −1.3 per cent for medical corporation-operated hospitals. For public institutions alone, the figure was −18.1 per cent, indicating particularly poor profitability[7],[8]. The overall deterioration in profitability may be attributed to increases in personnel and pharmaceutical expenditure outpacing growth in operating revenues.
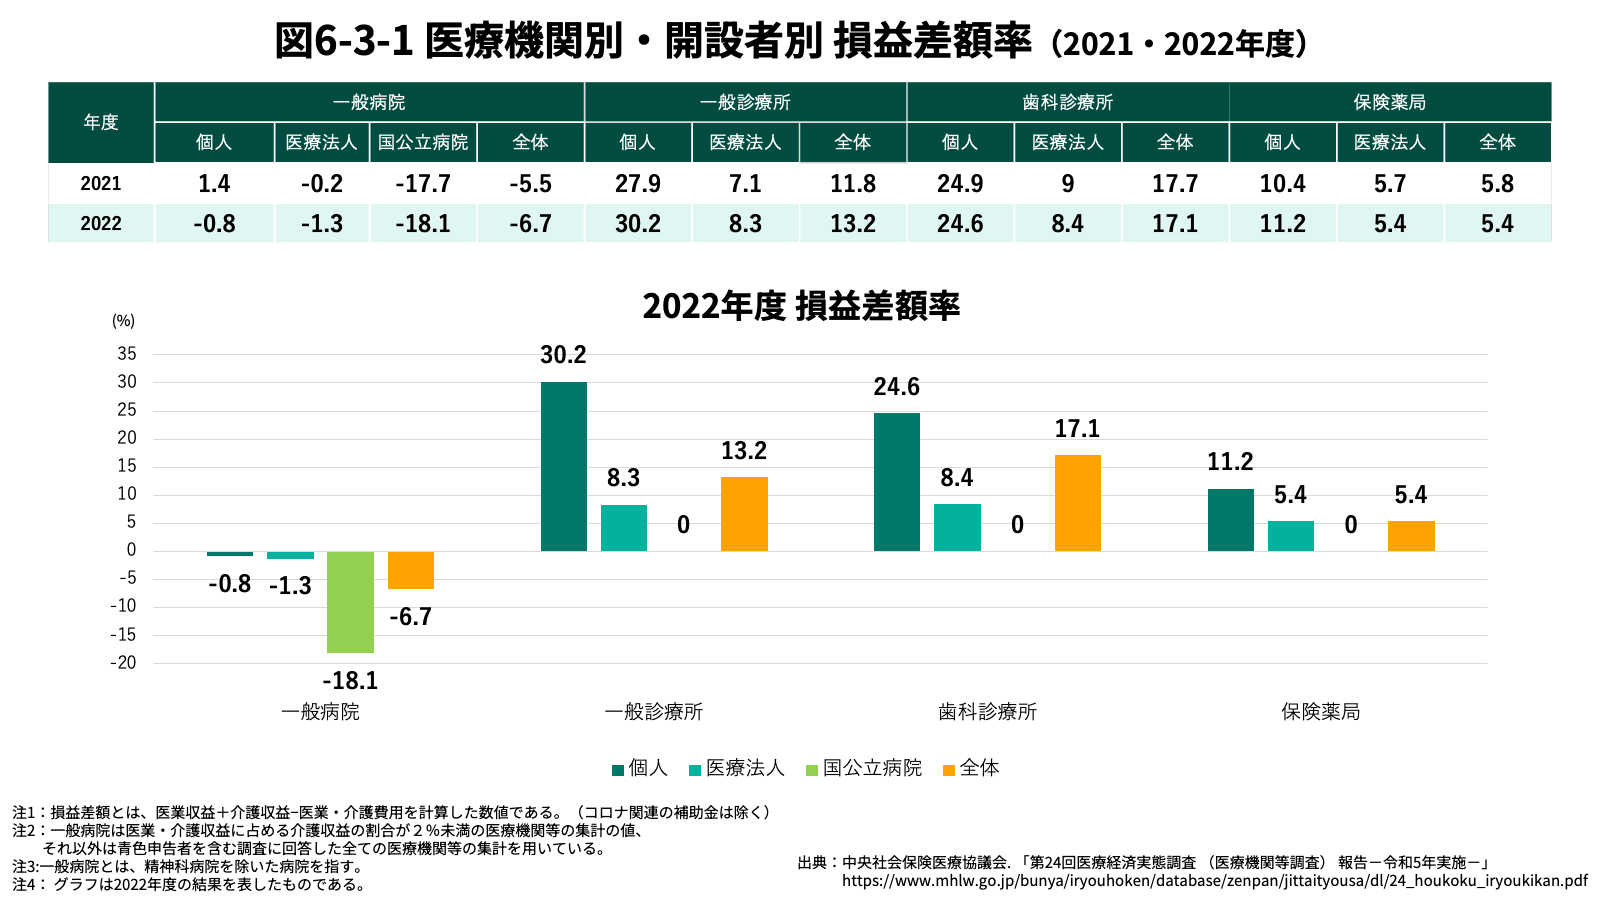
Public hospitals provide care in loss-making areas and remote regions, and a certain degree of deficit is offset through tax revenues.[9] Factors contributing to deficits include those inherent to public hospitals, such as continuation of loss-making departments and recruitment constraints, as well as broader social dynamics, including rapid price inflation, population decline, and COVID-19.[10] Public hospitals also exhibit higher ratios of personnel costs, pharmaceutical costs, and depreciation. In light of these circumstances, improvements in operational management, together with conversion of bed functions and downsizing in line with regional medical needs, are being pursued pursuant to the New Public Hospital Reform Guidelines. Medical corporation-operated general clinics, by contrast, recorded a surplus of +8.3 per cent in FY2022.[11]
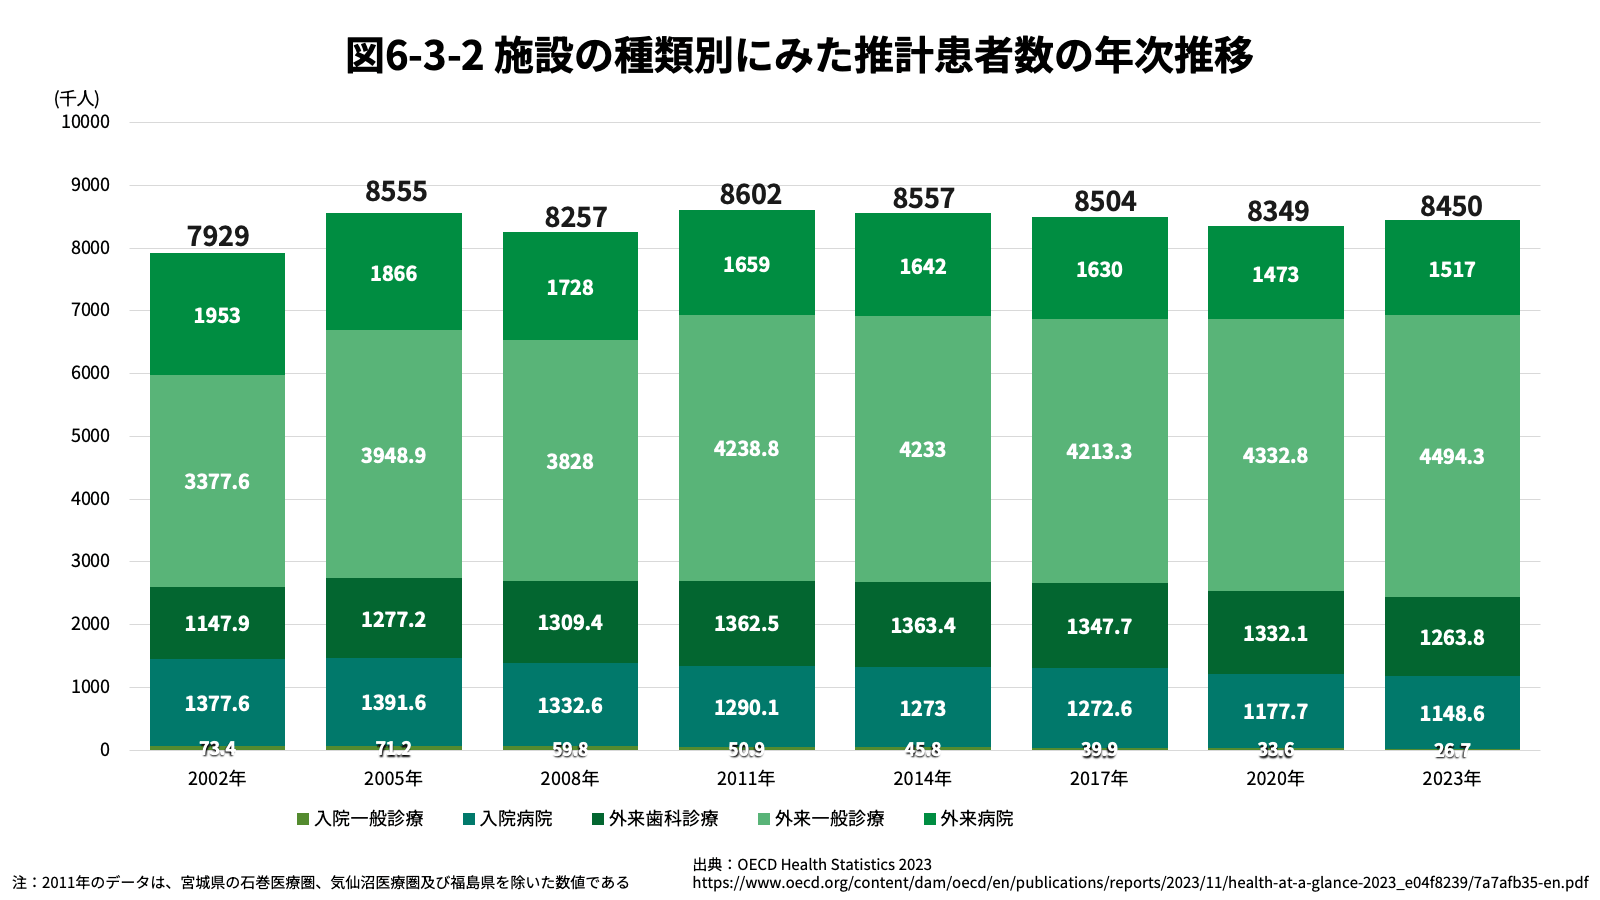
Considering the revenue side: the chart below illustrates annual trends in estimated patient numbers by facility type. In all years, outpatient cases considerably exceed inpatients, a predictable result, given that serious conditions requiring hospitalization occur less frequently. Longitudinally, inpatient numbers have declined since 2008, whilst outpatient numbers have been broadly stable since 2011. The number of patients admitted to general clinics has fallen steadily year on year.
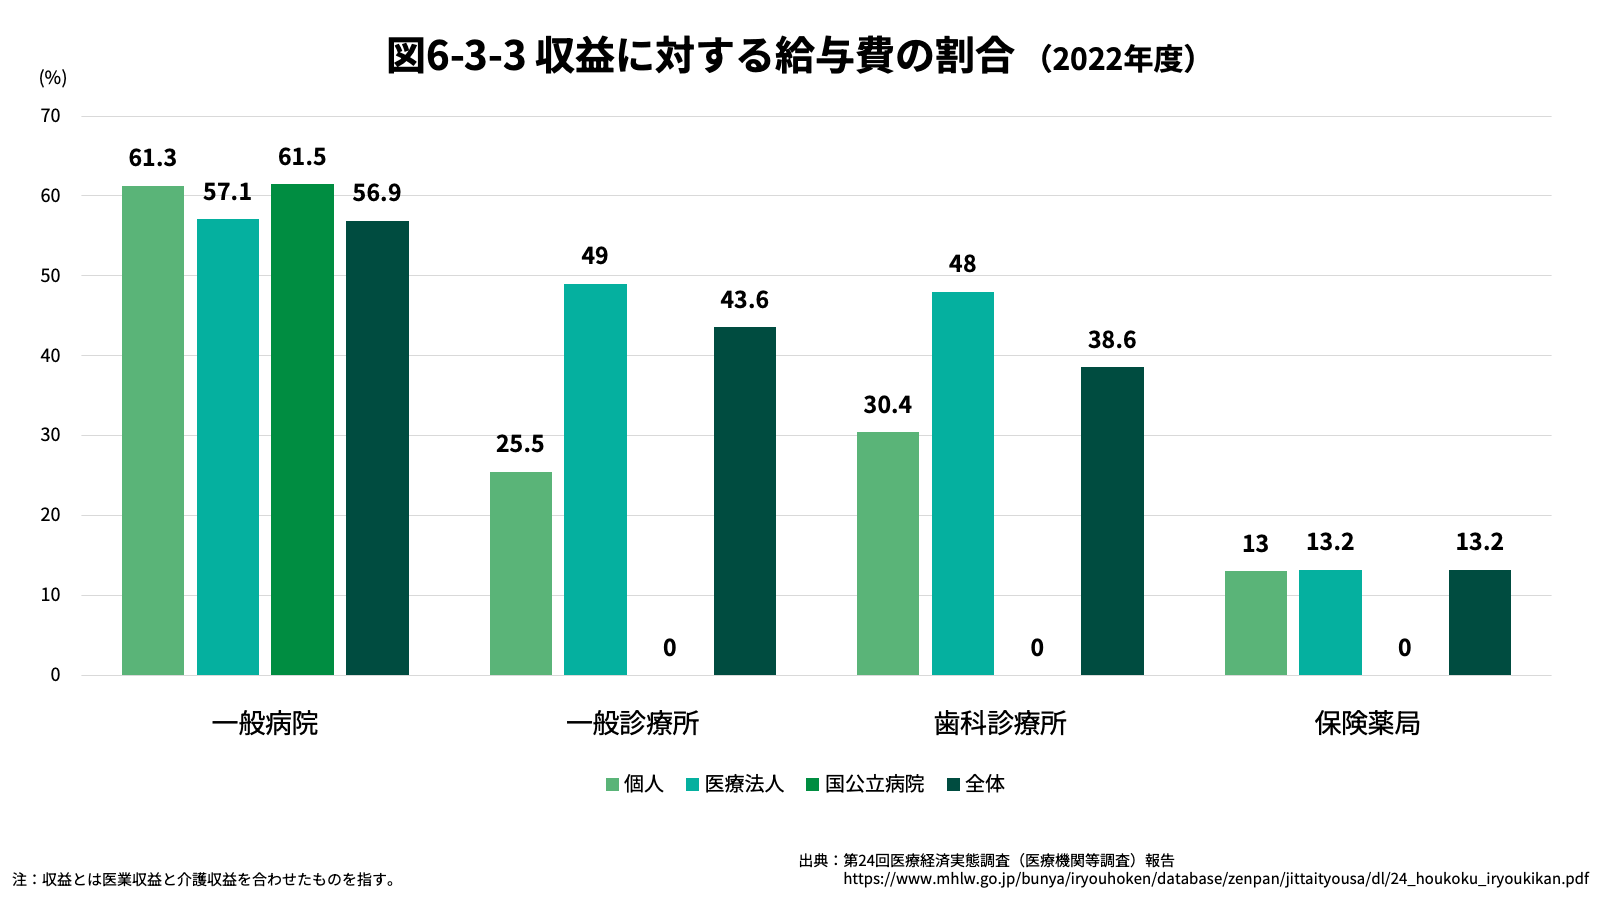
Turning to the expenditure side: the following chart depicts personnel costs as a proportion of revenue by institution type. The highest figure, observed at general hospitals, indicates that personnel costs account for close to 60 per cent of revenues, representing a significant operational challenge and a primary contributor to the deterioration in profit/loss margins.
- [7] Ministry of Health, Labour and Welfare. “Report of the 24th Survey of Medical Economic Conditions.” https://www.mhlw.go.jp/bunya/iryouhoken/database/zenpan/jittaityousa/dl/24_houkoku_iryoukikan.pdf
- [8] The profit/loss rate is defined as (medical/long-term care revenue − medical/long-term care costs) ÷ (medical/long-term care revenue). See: Ministry of Health, Labour and Welfare. “Circumstances Surrounding Medical Institutions.” https://www.mhlw.go.jp/content/10808000/001479599.pdf
- [9] Ministry of Finance. “Supplementary Reference Materials (FY2018 Fee Schedule Revision: 21st Survey of Medical Economic Conditions).” http://www.mof.go.jp/about_mof/councils/fiscal_system_council/sub-of_fiscal_system/proceedings/material/zaiseia291108/01.pdf
- [10] Japan Public Health Association. “Report on the Survey on the Management of Public Hospitals, FY2024.” https://www.jpha.or.jp/sub/topics/2025/20250425_2.pdf
- [11] Ministry of Health, Labour and Welfare. “Circumstances Surrounding Medical Institutions.” https://www.mhlw.go.jp/content/10808000/001479599.pdf
6.4 Micro Level 1: Incentive-Setting Through Fee Schedules
The fee schedule (shinryo hoshu) refers to the remuneration received by medical institutions and pharmacies for providing services or medicines within the scope of health insurance coverage. Points are assigned to individual insurance-covered medical services, devices, and pharmaceuticals; each institution calculates its reimbursement based on those points and receives payment from the insurer. For the purposes of calculation, one point equals ¥10. The MHLW prescribes all point values and eligibility criteria, and compliance is mandatory for all healthcare providers. Charging in excess of prescribed points is prohibited, and the combined use of insured and non-insured treatment (kongô shinryô or “mixed billing”) is, as a rule, not permitted. However, certain items are permitted under the Advanced Medical Care Benefit System (hoken-gai heiyô ryôyô-hi seido), which encompasses evaluated treatments, patient-initiated treatments, and selected treatments.[12]
The fee schedule system comprises two payment methods: fee-for-service and the Diagnosis Procedure Combination (DPC) per-diem payment system. Since the current health insurance system was established in 1961, fee-for-service has been foundational; however, its share has declined with the introduction of DPC. Nevertheless, because surgical procedures, endoscopic examinations, rehabilitative treatments, devices, and pharmaceuticals administered on the day of surgery are excluded from the DPC system, one-third of inpatient hospital revenues continues to be remunerated on a fee-for-service basis.[13] The following provides a detailed explanation of DPC.
It should be noted that the term “DPC” has been used with some ambiguity. During the deliberations preceding the system’s establishment, it was observed that the term referred both to: (1) the per-diem lump-sum payment system based on diagnosis group classification; and (2) the patient classification system itself. Originally coined as an acronym for the classification system, DPC (Diagnosis Procedure Combination) does not inherently denote a payment system. Accordingly, “DPC/PDPS (Diagnosis Procedure Combination / Per-Diem Payment System)” was adopted as the formal designation of the payment system. In the following discussion, the abbreviated term “DPC” will be used throughout for the sake of simplicity and in accordance with common usage.
Diagnosis Procedure Combination (DPC) Payment System
DPC is a fee schedule system unique to Japan, introduced in the early 2000s against a backdrop of rising concern about healthcare costs, extended hospitalization periods, increasing demand for medical services, and the sustainability of the system.
Between 1998 and 2004, a lump-sum payment system for acute inpatient care was piloted at ten national hospitals. The trial revealed that, whilst there was considerable variation in length of stay even for the same condition, a per-diem lump-sum approach produced a smaller discrepancy between lump-sum points and actual treatment costs than an episode-based approach, and that there was an incentive to reduce the per-diem rate. These findings led to the adoption of the current DPC system, in which a per-diem lump-sum fee is calculated in accordance with length of stay.
The principal objective of DPC is to promote the standardization and transparency of medical care. By constructing an objective clinical information database, the aim is to clarify outcomes and areas for improvement, reduce inter-hospital quality disparities, and improve overall standards. Patients benefit from access to objective data on standard treatments and pricing. A reduction in average length of stay is also anticipated. DPC is a lump-sum payment system analogous to the DRG/PPS used in the United States, employing DPC codes constructed primarily on the basis of disease codes and procedures (comprising 3,248 classifications as of April 2024).[14] Key features include a per-diem lump-sum evaluation and the partial incorporation of fee-for-service elements. Reimbursement is on a lump-sum basis for inpatient treatment falling within DPC-designated diagnosis groups, and on a fee-for-service basis for cases that do not.
The Mechanism of Fee Calculation Under DPC
Items subject to the lump-sum evaluation component include the basic hospitalization fee, examinations (including diagnostic imaging), injections, medications, and procedures with a fee schedule value of fewer than 1,000 points, calculated on the basis of per-diem points designated for each DPC classification, length of stay, and institution-specific coefficients. Surgical procedures, radiotherapy, anesthesia, and procedures with a value of 1,000 points or more are excluded from the lump-sum evaluation and reimbursed on a fee-for-service basis.
In recent years, a nationwide review of institution-specific coefficients has been undertaken with the aim of reducing disparities between institutions with equivalent levels of clinical function. Institution-specific coefficients comprise the following:[15]
Basic Coefficient
A coefficient established to provide an incentive for medical institutions, such as the main campuses of university hospitals, that fulfil functions and roles distinct from those of other facilities.
Function Evaluation Coefficient I
A coefficient that evaluates items applicable to all inpatients (such as the differential for acute inpatient fee rates and supplementary hospitalization charges).
Function Evaluation Coefficient II
A coefficient that evaluates incentives for system-wide efficiency improvements resulting from participation in the DPC/PDPS scheme. It encompasses four sub-components: the efficiency coefficient, complexity coefficient, coverage coefficient, and regional medical coefficient.
Emergency Correction Coefficient
A coefficient that corrects for discrepancies in medical resource inputs during the initial period of hospitalization for emergency inpatients.
Abrupt Change Mitigation Coefficient
A coefficient set for the single financial year of a fee schedule revision, designed to mitigate the impact of sudden changes.
The method of calculation varies according to the stage of hospitalization, with three defined hospitalization periods. The per-diem lump-sum fee for Hospitalization Period I is set at a higher rate than those for Periods II and III. Period II runs from its first day to the mean length of stay; its lump-sum fee, whilst varying by diagnosis group, is lower than Period I in light of average daily resource inputs. Period III is the final defined hospitalization period, with a per-diem fee set lower than Period II.[16] Where hospitalization extends beyond Period III, the fee schedule is calculated on a fee-for-service basis.
There is ongoing debate as to whether the DPC system is achieving its intended outcomes. When DPC was introduced, cost containment, in addition to shorter average length of stay, was anticipated. Whilst average length of stay has been shortened (see Section 4), analyses have been published suggesting this has not yet directly translated into a reduction in medical costs. It has been pointed out that fee schedule amounts are set on a per-diem rather than a per-episode basis, and that many medical services remain subject to fee-for-service reimbursement. Furthermore, data indicate that whilst average length of stay has fallen, the number of new admissions has increased, and deliberation continues on how to reduce medical costs.[17]
- [12] Ministry of Health, Labour and Welfare. “The Advanced Medical Care Benefit System.” http://www.mhlw.go.jp/file/06-Seisakujouhou-12400000-Hokenkyoku/20170925.pdf
- [13] Gerard Anderson and Naoki Ikegami (2011). “How Can Japan’s DPC Inpatient Hospital Payment System Be Strengthened? Lessons from the U.S. Medicare Prospective System.” Japan-U.S. Health Policy Project, Policy Recommendation Vol. 1. https://hgpi.org/wp-content/uploads/JAPANS%20DPC%20INPATIENT%20HOSPITAL%20PAYMENT%20SYSTEM_JP.pdf
- [14] Ministry of Health, Labour and Welfare. “Overview of the FY2024 Fee Schedule Revision (General Medical Edition).” https://www.mhlw.go.jp/content/12400000/001252076.pdf
- [15] Ministry of Health, Labour and Welfare. (2024). Overview of the FY2024 revision of medical fees (medical services overall version). https://www.mhlw.go.jp/content/12400000/001252076.pdf
- [16] Ministry of Health, Labour and Welfare. “Response under the DPC System towards the FY2018 Fee Schedule Revision (Draft).” http://www.mhlw.go.jp/file/05-Shingikai-12404000-Hokenkyoku-Iryouka/0000186975.pdf
- [17] Gerard Anderson, Naoki Ikegami.(2011) . “HOW CAN JAPAN’S DPC INPATIENT HOSPITAL PAYMENT SYSTEM BE STRENGTHENED? Lessons from the U.S. Medicare Prospective System“ Japan-U.S. health policy project Policy Recommendation vol.1. https://hgpi.org/wp-content/uploads/JAPANS%20DPC%20INPATIENT%20HOSPITAL%20PAYMENT%20SYSTEM_JP.pdf
6.5 Micro Level 2: Medical Cost Optimization
In order to curb excessive growth in medical expenditure driven by rapid population ageing and other factors, a range of medical cost optimization measures has been implemented. One such measure is the Medical Cost Optimization Plan (Iryo-hi Tekisei-ka Keikaku). In accordance with the target objectives and estimation methods set out in the national government’s Basic Policy on Medical Cost Optimization, prefectural governments draw up their own Plans.[18]
During the First Period (FY2008–2012) and Second Period (FY2013–2017), implemented in five-year cycles, the key objectives were the shortening of average length of hospital stay and improvement in uptake rates for specific health check-ups. In the Third Period (FY2018–2023), in addition to improving specific health check-up uptake, new objectives were incorporated: prevention of deterioration of diabetes, promotion of generic medicine use, and appropriate use of medicines (optimization of duplicate prescribing and polypharmacy). Inpatient medical costs were to be estimated reflecting the outcomes of promoting differentiation and integration of bed functions. In the Fourth Period (FY2024–2029), new objectives were added: effective and efficient provision of medical and long-term care for elderly persons with complex needs, and effective and efficient utilization of medical resources. The effective promotion of measures through digital technologies was also specified, as was the establishment of coordination mechanisms between prefectural governments and relevant stakeholders.[19]
Promotion of Generic Medicine Use
Since 2007, Japan has pursued a policy of actively promoting generic medicines, setting specific volume-share targets with the aim of reducing patient burden and improving the efficiency of healthcare expenditure whilst maintaining quality of care.[20] As of 2023, the volume share of generic medicines stands at 80.2 per cent, with 29 prefectures recording a share of 80 per cent or more (based on FY2022 data).[21] The Fourth Period Basic Policy specifies that, whilst maintaining a stable supply of medicines as a fundamental principle, numerical targets are to be set at the prefectural level in line with new government objectives, and that necessary measures will be taken, including support for insurers in implementing differential notification and raising awareness of formularies[22] among healthcare professionals.[23]
Effective and Efficient Utilization of Medical Resources
The appropriate use of finite medical resources contributes not only to the reduction of medical costs but also to the reduction of patient burden. For medical practices identified as being of limited effectiveness, such as the prescription of antibiotics for acute respiratory infections or acute diarrhea, efforts are under way to monitor current practices using nationally provided data, and to raise public and professional awareness.
Regional disparities in national medical expenditure and in the volume of medical resource inputs also present a challenge. According to FY2023 data, per capita national medical expenditure in Kochi Prefecture, the highest in Japan, is approximately 1.4 times that of Saitama Prefecture, the lowest.[24] The government aims to halve regional disparities in age-adjusted per capita national medical expenditure. Measures employed include the Regional Medical Vision, the Medical Cost Optimization Plan, and the strengthening of incentives for health promotion, as discussed in Section 4 and this chapter. With regard to the volume of medical resource inputs, optimization is being pursued through support for physician recruitment using the Regional Medical and Long-Term Care Comprehensive Fund, construction and equipment of facilities, and clarification of role allocation between institutions.[25] In recent years, attention has also been drawn to refill prescriptions (rifiru shohozen), which can be used repeatedly up to three times by eligible patients with stable conditions. Expected simultaneously to shorten hospital waiting times and reduce patient financial burden, their wider dissemination is under consideration.[26]
Specific Health Check-ups and Specific Health Guidance
Specific Health Check-ups and Specific Health Guidance focus on visceral obesity, characterized by excessive accumulation of visceral fat, and metabolic syndrome, a condition in which multiple lifestyle-related disease risk factors (hypertension, hyperglycemia, and dyslipidemia) are present in combination. Specific Health Check-ups identify lifestyle-related disease risks at an early stage; Specific Health Guidance then helps individuals review lifestyle habits such as physical activity, diet, and smoking, with the aim of reducing visceral fat and thereby preventing and managing lifestyle-related diseases.[27] The scheme targets individuals aged 40 to 74 enrolled in medical insurance; the uptake rate for FY2023 was 59.9 per cent. Whilst the overall rate has risen year on year, significant variation exists by insurer type: municipal National Health Insurance 38.2%; National Health Insurance Associations 51.9%; Japan Health Insurance Association 58.7%; Mariners’ Health Insurance 52.8%; Health Insurance Societies 82.9%; Mutual Aid Associations 82.6%.[28] The new Medical Cost Optimization Plans envisage the introduction of outcome-based evaluation and use of ICT, with the expectation of further improvements in uptake rates and more effective implementation.[29]
Healthcare Digital Transformation (Healthcare DX)
Healthcare digital transformation is indispensable for improving the efficiency and quality of services in the healthcare sector. Accelerating data collection, expanding its scope, and advancing the “visualization” of healthcare through digitalization and data sharing are also critically important in constructing a system capable of mounting a swift response to the next infectious disease crisis. In 2022, a Healthcare DX Promotion Headquarters was established, chaired by the Prime Minister, with a cross-ministerial remit organized around three pillars: the establishment of a national healthcare information platform, standardization of electronic medical record information, and fee schedule revision DX. To advance these initiatives, a “Healthcare DX Reiwa Vision 2030” Promotion Team, led by the Minister of Health, Labour and Welfare, was established within the Ministry to examine and develop the specifics of implementation.[30]
Data Health Plans
Japan, as a country with exceptional longevity, has since the early twenty-first century seen a policy trend emphasizing prevention and health promotion. Building on the achievement of electronic standardization of specific health check-up data and health guidance data, it has been required since 2015 that all insurers analyze claims and other data, and formulate and publish “Data Health Plans”, business plans designed to maintain and promote the health of members based on such analysis. The purpose is to implement health management initiatives effectively and efficiently through a PDCA cycle, contributing both to member health and to employers’ human capital management. More recently, efforts are being made to integrate Data Health Plans with other healthcare plans.[31]
Health Management
Health management (kenko keiei) refers to the approach of considering employee health management from a managerial perspective and implementing it strategically. The continuously rising level of national medical expenditure has been identified as a factor adversely affecting the financial position of health insurance societies. As premiums increase, the burden on individuals and corporations rises. Furthermore, with the working-age population shrinking due to declining birth rates and population ageing, deterioration in employee health leads to declining corporate productivity and may adversely affect talent acquisition. For corporations, maintaining and improving employee health therefore represents not only a means of optimizing medical costs and enhancing productivity, but also an investment in the future.[32]
Health management contributes to the enhancement of corporate image, organizational vitality, and business performance. The Ministry of Economy, Trade and Industry designates companies engaged in strategic health management as “Health Management Brand” companies, in principle selecting one company per industry sector, with the aim of ensuring that such companies are socially recognized and that health management is further promoted. In July 2017, the MHLW published the “Collaborative Health Guidelines for Promoting Data Health and Health Management,” which set out procedures and case studies for implementing health management through “Collaborative Health” (Colabo Health), an approach in which employers and health insurance societies work in tandem to promote member health. It is envisaged that the promotion of Collaborative Health will allow Data Health and Health Management to function as mutually reinforcing and complementary elements.[33]
Strengthening Incentives for Individuals and Insurers
One aspect of strengthening incentives for prevention and health promotion is the reinforcement of incentives directed at both individuals and insurers. With respect to individual incentives, insurers award healthcare points and provide insurance premium support in accordance with the preventive and health-promotion activities of their members. Examples include the granting of health goods or human health examination discount vouchers in recognition of completing specific health check-ups or improving health check-up results.[34]
With regard to insurer incentives, revisions were made under the 2015 amendments to the National Health Insurance Act (coming into effect from FY2018) to enable each type of insurer to exercise its functions more readily. One measure was the creation of an Insurer Effort Support System for municipal National Health Insurance, along with a mechanism for evaluating initiatives, such as diabetes deterioration prevention on the basis of objective indicators and granting support funds accordingly. Another was a restructuring of the premium surcharge/reduction mechanism for Health Insurance Societies and Mutual Aid Associations, moving from evaluation based solely on specific health check-up implementation to a comprehensive framework incorporating multiple indicators including cancer screening and collaboration with employers. The mechanism took effect from FY2018, applying modest surcharges broadly across many insurers and graduated reductions in accordance with the level of attainment of designated indicators.
- [18] Ministry of Health, Labour and Welfare. “Revision of the Basic Policy on Medical Cost Optimization and Medical Cost Optimization Plans.” http://www.mhlw.go.jp/file/05-Shingikai-12401000-Hokenkyoku-Soumuka/0000148008.pdf
- [19] Ministry of Health, Labour and Welfare. “The Fourth Period Medical Cost Optimization Plan (FY2024–2029).” https://www.mhlw.go.jp/content/12400000/001123575.pdf
- [20] Ministry of Health, Labour and Welfare. “Annual Report on Health, Labour and Welfare, FY2023.” https://www.mhlw.go.jp/wp/hakusyo/kousei/22/dl/zentai.pdf
- [21] Ministry of Health, Labour and Welfare. “Review of the Fourth Period Basic Policy on Medical Cost Optimization.” https://www.mhlw.go.jp/content/12401000/001309909.pdf
- [22] A formulary refers to a prescribing guideline that standardizes the criteria for medicine selection within a hospital or region.
- [23] Ministry of Health, Labour and Welfare. “Summary: Fourth Period Basic Policy on Medical Cost Optimization.” https://www.mhlw.go.jp/content/12400000/001123575.pdf
- [24] Ministry of Health, Labour and Welfare. “Analysis of Regional Disparities in Medical Expenditure (Electronic Claims Data), FY2023.” https://www.mhlw.go.jp/content/iryohi_r05den.pdf
- [25] Ministry of Health, Labour and Welfare. “Summary: Fourth Period Basic Policy on Medical Cost Optimisation.” https://www.mhlw.go.jp/content/12400000/001123575.pdf
- [26] Digital Agency. “Dashboard on Awareness and Usage of Refill Prescriptions.” https://www.digital.go.jp/resources/govdashboard/refill-prescription
- [27] Government Public Relations Online. “What are Lifestyle-Related Diseases? Regular Check-ups for Prevention and Early Detection!” https://www.gov-online.go.jp/useful/article/201402/1.html#secondSection
- [28] Ministry of Health, Labour and Welfare. “Implementation Status of Specific Health Check-ups and Specific Health Guidance, FY2023.” https://www.mhlw.go.jp/content/12400000/001492019.pdf
- [29] Ministry of Health, Labour and Welfare. “Summary: Fourth Period Basic Policy on Medical Cost Optimisation.” https://www.mhlw.go.jp/content/12400000/001123575.pdf
- [30] Ministry of Health, Labour and Welfare. “Annual Report on Health, Labour and Welfare, FY2023.” https://www.mhlw.go.jp/wp/hakusyo/kousei/22/dl/zentai.pdf
- [31] Ministry of Health, Labour and Welfare, Insurance Bureau; Health Insurance Bureau Federation. “Guidance on the Preparation of Data Health Plans.” https://www.mhlw.go.jp/content/12400000/001223896.pdf
- [32] Ministry of Economy, Trade and Industry. “Guidebook on Corporate Health Management (Revised 1st Edition).” http://www.meti.go.jp/policy/mono_info_service/healthcare/kenkokeiei-guidebook2804.pdf
- [33] Ministry of Health, Labour and Welfare. “Collaborative Health Guidelines for Promoting Data Health and Health Management.” http://www.mhlw.go.jp/stf/houdou/0000170819.html
- [34] Ministry of Health, Labour and Welfare. “On Insurer Incentives.” http://www.mhlw.go.jp/file/05-Shingikai-12601000-Seisakutoukatsukan-Sanjikanshitsu_Shakaihoshoutantou/0000163331.pdf